[Home]
The Dewetra platform manages and allows to visualise various type of geospatial data. From the technical point of view, these data can be divided in 2 main categories:
- Static datasets, no time-dependant products.
- Dynamic datasets, time-varying data providing information changing with different update rate and time steps.
This section describes how to:
- Upload of static datasets, using geoserver
- Create dynamic products
- Managing the publication of both static and dynamic products on myDewetra, using the Dewetra 2.0 Service Manager Django.
¶ Static data
Static datasets refer to geospatial data providing basic information and information about hazard, risk, exposure or past events (tipically not varying continuously in time). These datasets can be organised in geo-referenced format and integrated into the Dewetra platform for visualisation in the geo-viewer and to cross-reference and overlap this information with dynamic datasets to build real-time risk scenarios.
These geo-referenced data, duly stored in a data exchange folder of the reference data server of the Dewetra platform, have to be processed with 3 operations in order to be displayed on the Dewetra Platform:
- Publishing on the GeoServer web service
- Definition of the display style (legend, colours, size)
¶ Uploading on Geoserver
The Geoserver service is an open source server for sharing georeferenced data. The home page of the Geoserver is presented as in the image below and available at the following link:
https://stlucia.mydewetra.cimafoundation.org/dds/web
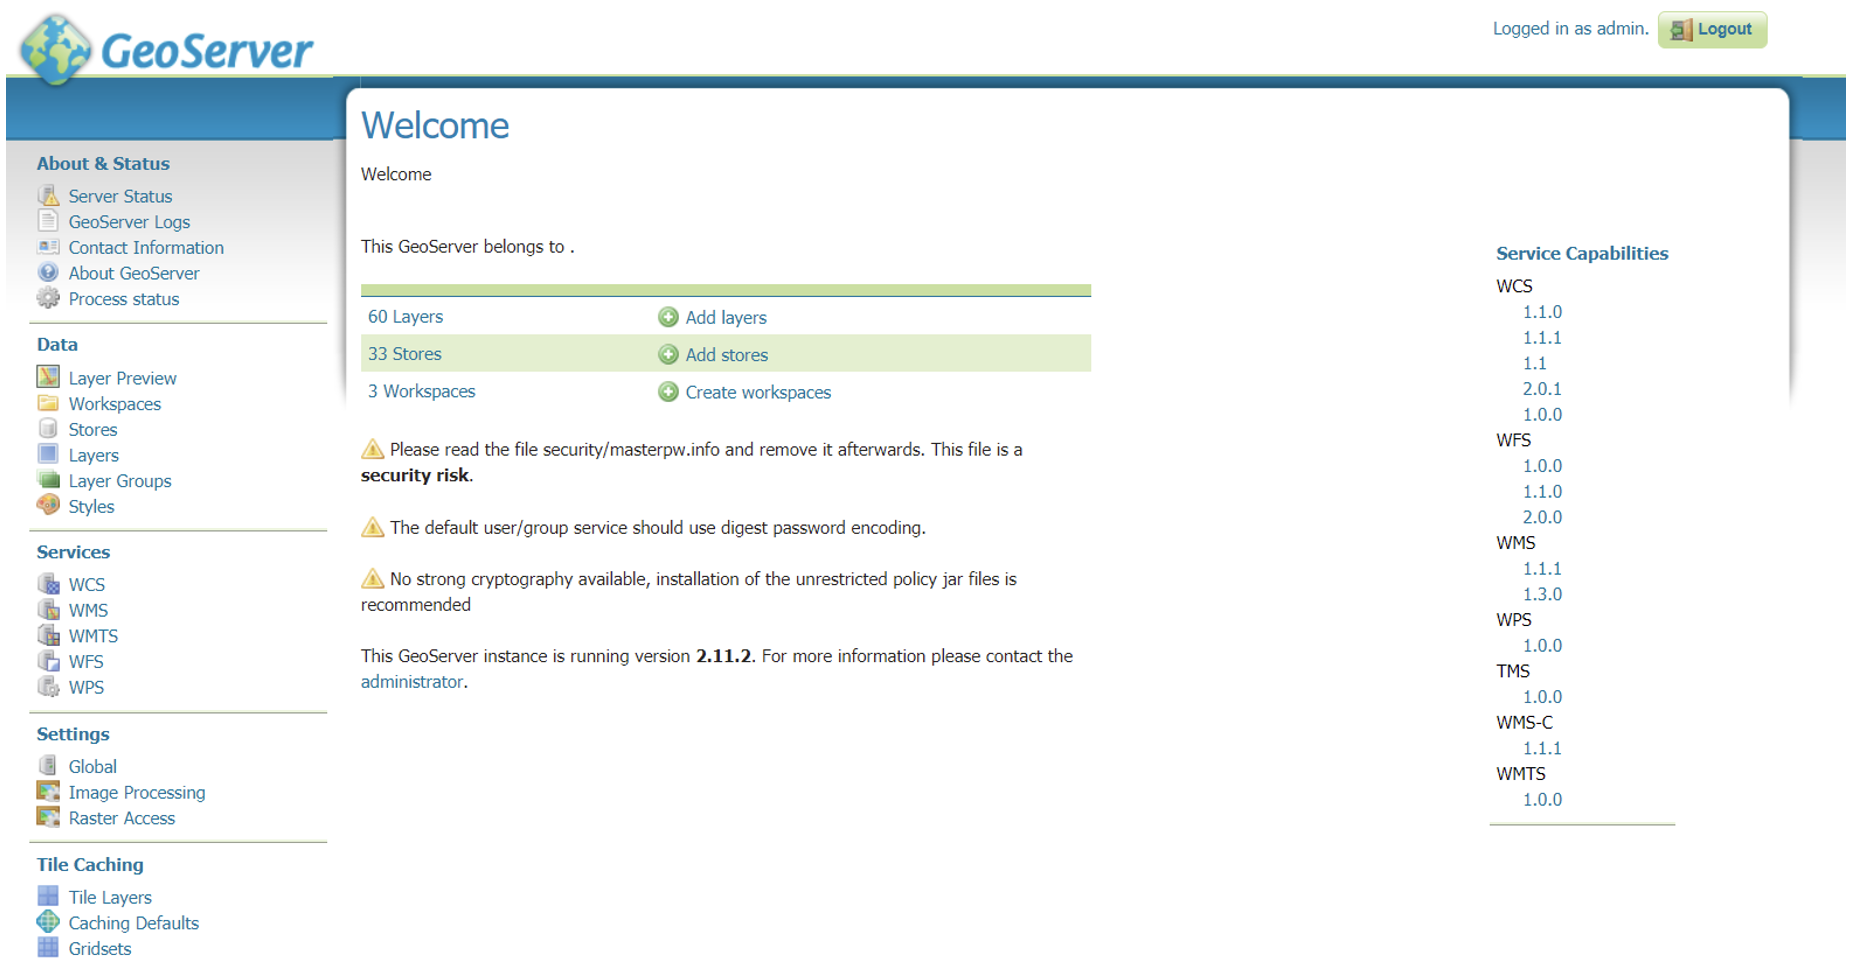
The Geoserver service is organised in workspaces, in which several data stores can be created for storing georeferenced data. From a single data store, one or more layers can be created (or, according to the name of the service, "published"), which correspond to possible versions or graphical representations of the data in the store. Each layer can be associated with a style, which can be customised, to define the graphical representation that will be given to the geo-referenced data when it is published in a geo-viewer (more details in the next point).
To upload data to the GeoServer service, you first have to create a data store where you will host the georeferenced data to be displayed on the Dewetra Platform.
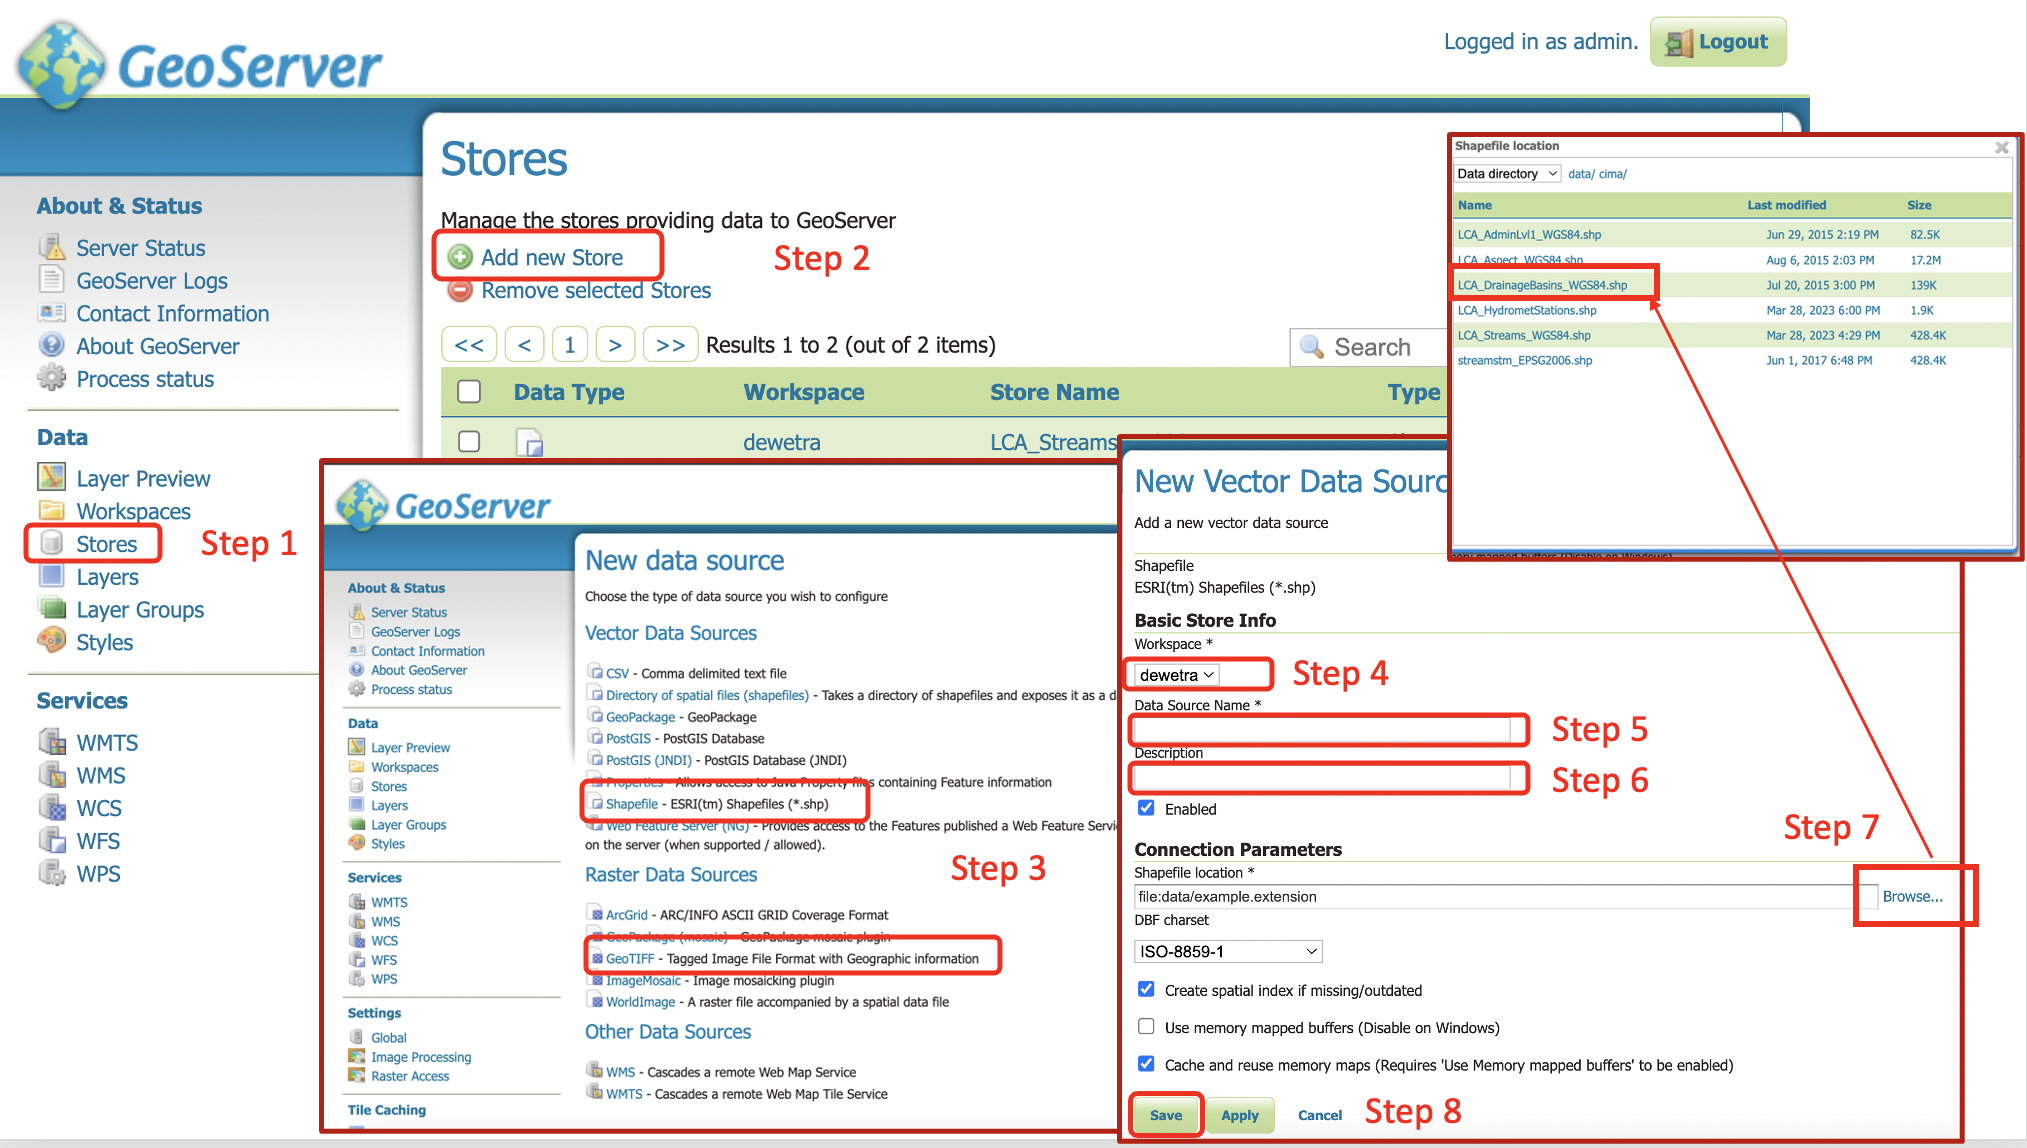
To create a store and host the data, the following steps must be followed:
- Go to the "Stores" page.
- Select the function "Add a new store".
- Choose the type of georeferenced file (or data source) (e.g. shapefile or raster).
- On the new store page, select the corresponding workspace where you want to host the store.
- Choose the location of the data in the exchange folder of the physical data server associated to the Dewetra Platform.
- Copy the name of the data (with the same name as in the exchange folder of the physical data server) in the space dedicated to the name of the store.
- Add a more detailed description of the data (optional).
- Click "Save".
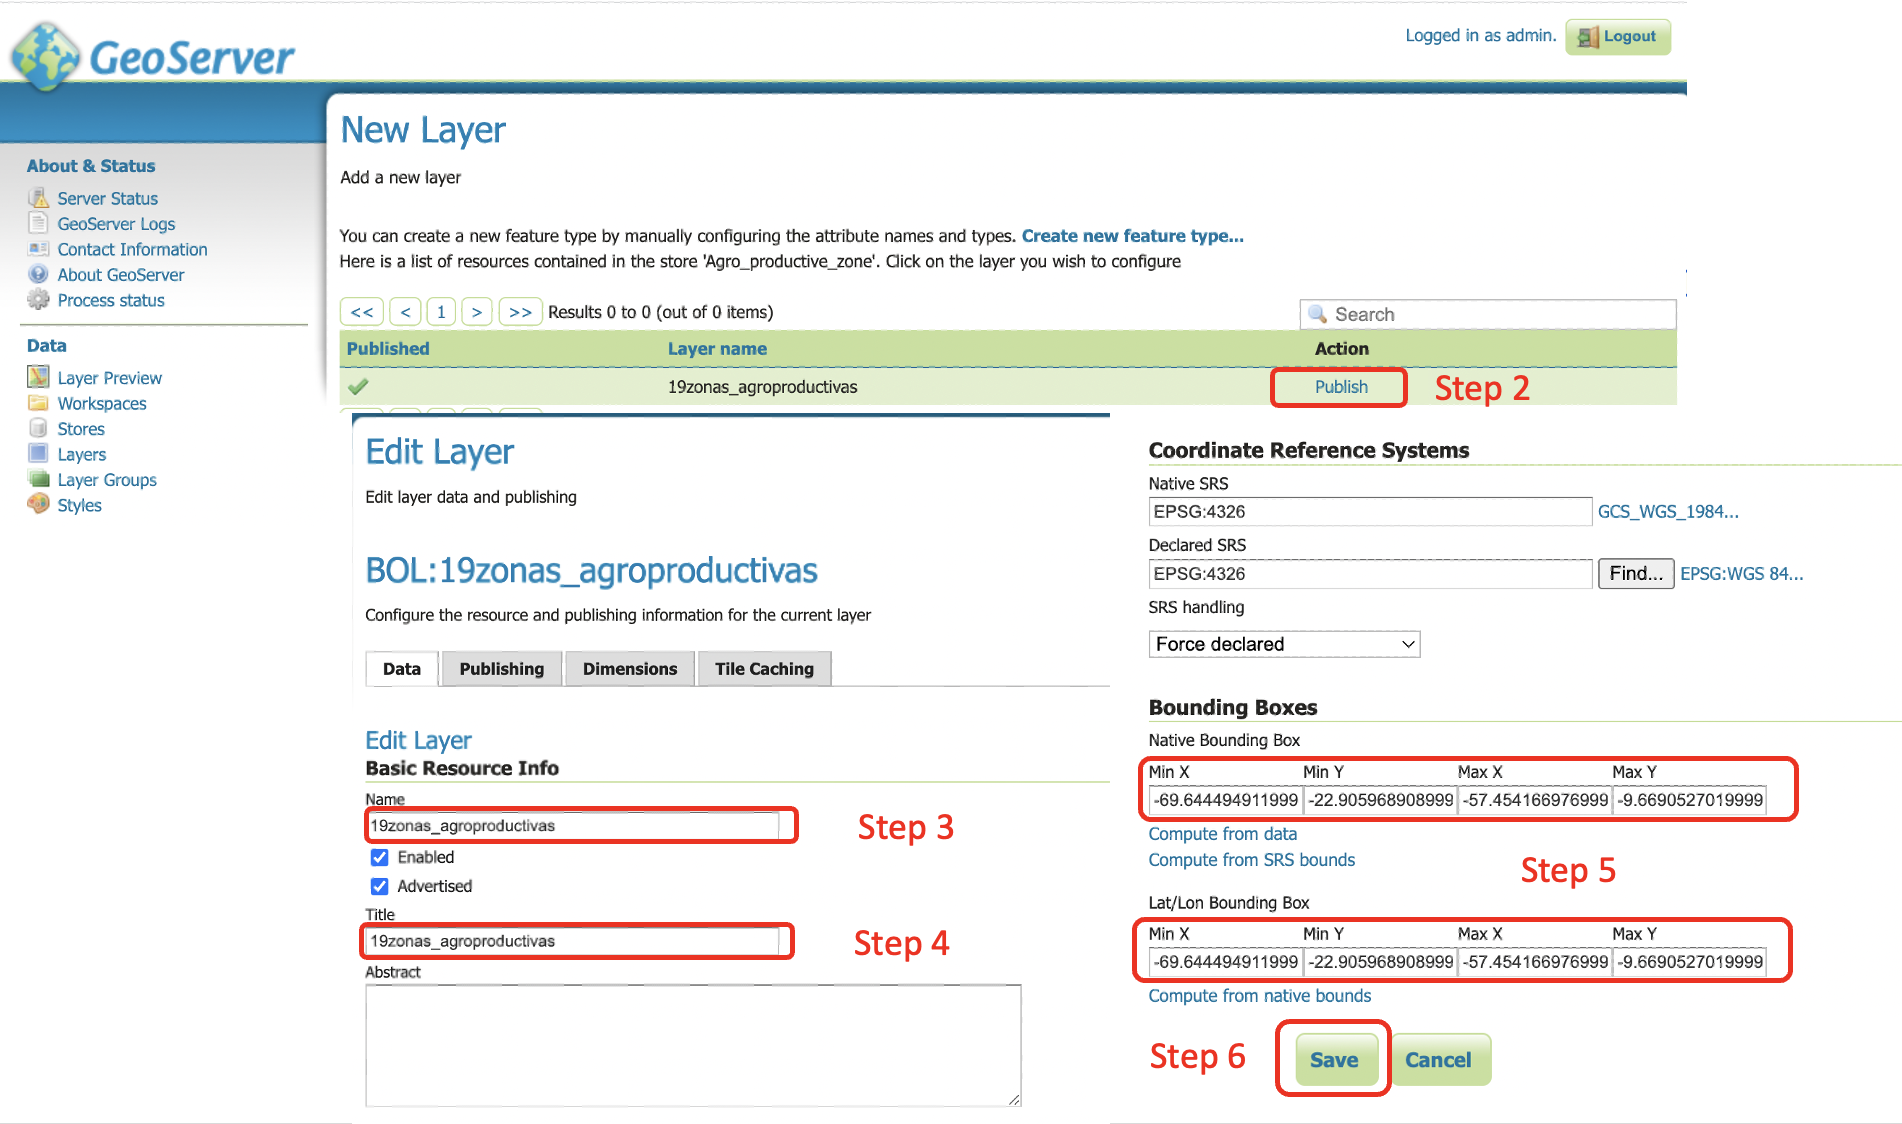
Once the data store has been successfully created, you can proceed to the creation of a layer:
- When saving the data store, a page for the creation of a new layer is automatically opened.
- Click on the "Publish" button and the page for the configuration of the new layer opens.
- Define the name of the layer (by default it is autocompiled with the name of the data store).
- Define the Title of the layer (by default it is autocompiled with the data store name).
- Compute the bounding box coordinates from the data (autocompilation by clicking on the appropriate buttons).
- Click "Save".
¶ Defining the display style
The GeoServer service has a page dedicated to "Styles" which contains all the graphic visualisation styles of the data used in the service.
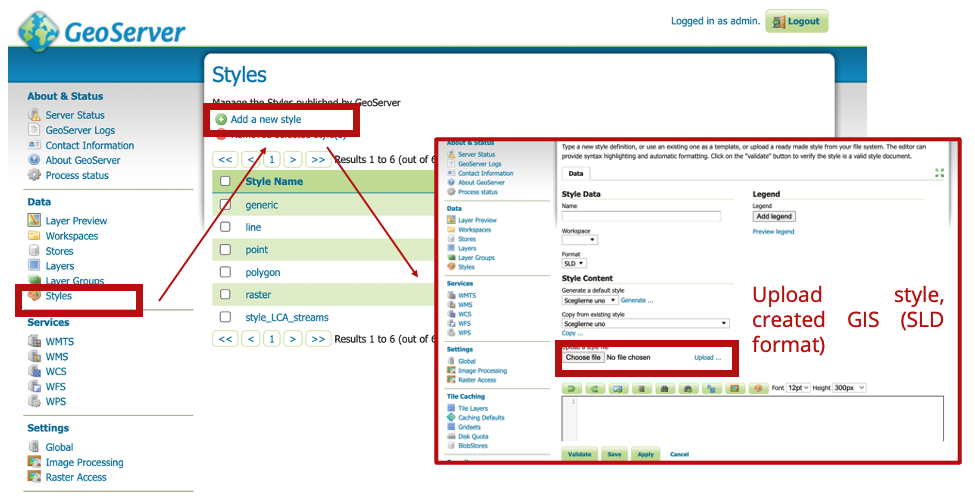
The user can create a new style according to the graphical representation he wants to give to the data with the following steps:
- Go to the "Styles" page
- Choose the function "Add a new style"
- Define the Name of the style
- Define the workspace where to place the new style
- Define the style in three different ways:
- Copy an existing style
- Upload a defined .sld file created in GIS software to the GeoServer service
- Manually write all the xml code defining the style
- Click "Validate" to check that there are no errors in the xml code
- Click "Submit" to save the new style
¶ Assign style, publish and check preview
Having created or available a style to assign to the layer, the final steps towards publication on geoserver can be undertaken:
- Go to the “Layer” page
- Search for the layer name and open it
- Select the second tab, “Publishing"
- Under the “WMS Settings” section, in the Default style drop-off menu, search for the style name and select it
- Save
- Go to the “Layer Preview” page
- Search for the layer name and click preview using OpenLayers
¶ Dynamic data
Dynamic datasets are time-varying data providing information changing with different update rate and time steps. The publication of dynamic datasets on the Dewetra platform is possible thanks to the functionalities of the Dewetra Data Server (DDS). Being Dewetra a distributed architecture, publication of dynamic products is possible in two modalities:
- Creating a connection to an existing external DDS or WMS, through Django
- Publishing data stored in the local server, creating a tailored configuration
¶ Connecting to existing external DDS
This operation can be performed using Django, through the following steps:
- Access Django: https://stlucia.mydewetra.cimafoundation.org/admin
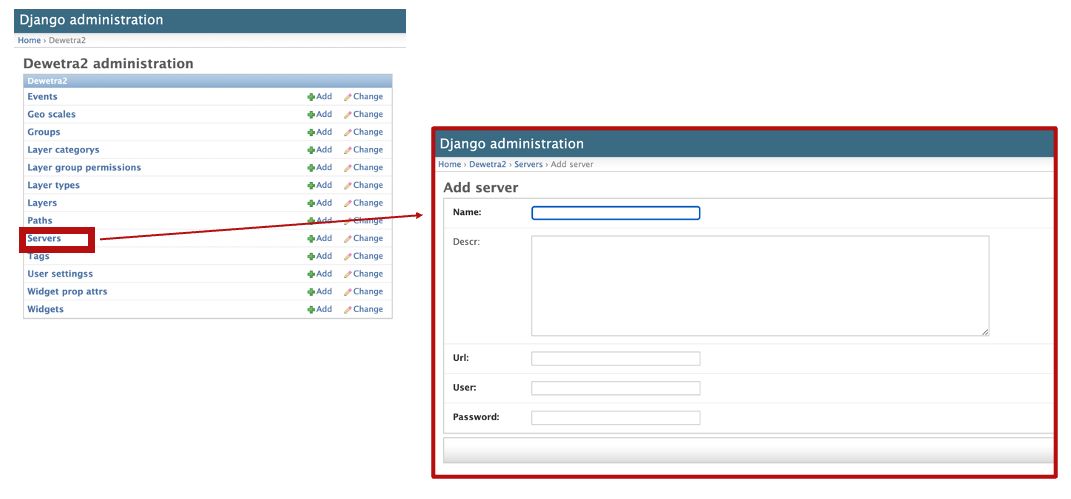
- Go to the “Servers” page
- Click on “Add Server” on the top right corner
- Compile the form with required information, including server name, description, url and credentials.
- Knowing the layer-id (name), a specific layer available in the external server can be integrated in Dewetra, using indications provided at section “”.
This connection with an external server is valid also for publishing static data, available on the existing external DDS or WMS.
Here example of the information for creating a server connecting to GloFAS WMS service:
Name: GLOFAS_WMS
Descr: GLOFAS_WMS
Url: http://globalfloods-ows.ecmwf.int/glofas-ows/ows.py
User: user
Password: pwd¶ Connecting to existing external DDS
To enable publication of dynamic products stored in the local server, a specific system configuration is required, which consists of three steps:
- description of the name and variables of the index file, including its location on the server
- specification of the component used by the system for the interpretation of the data
- publication on Dewetra, using Django
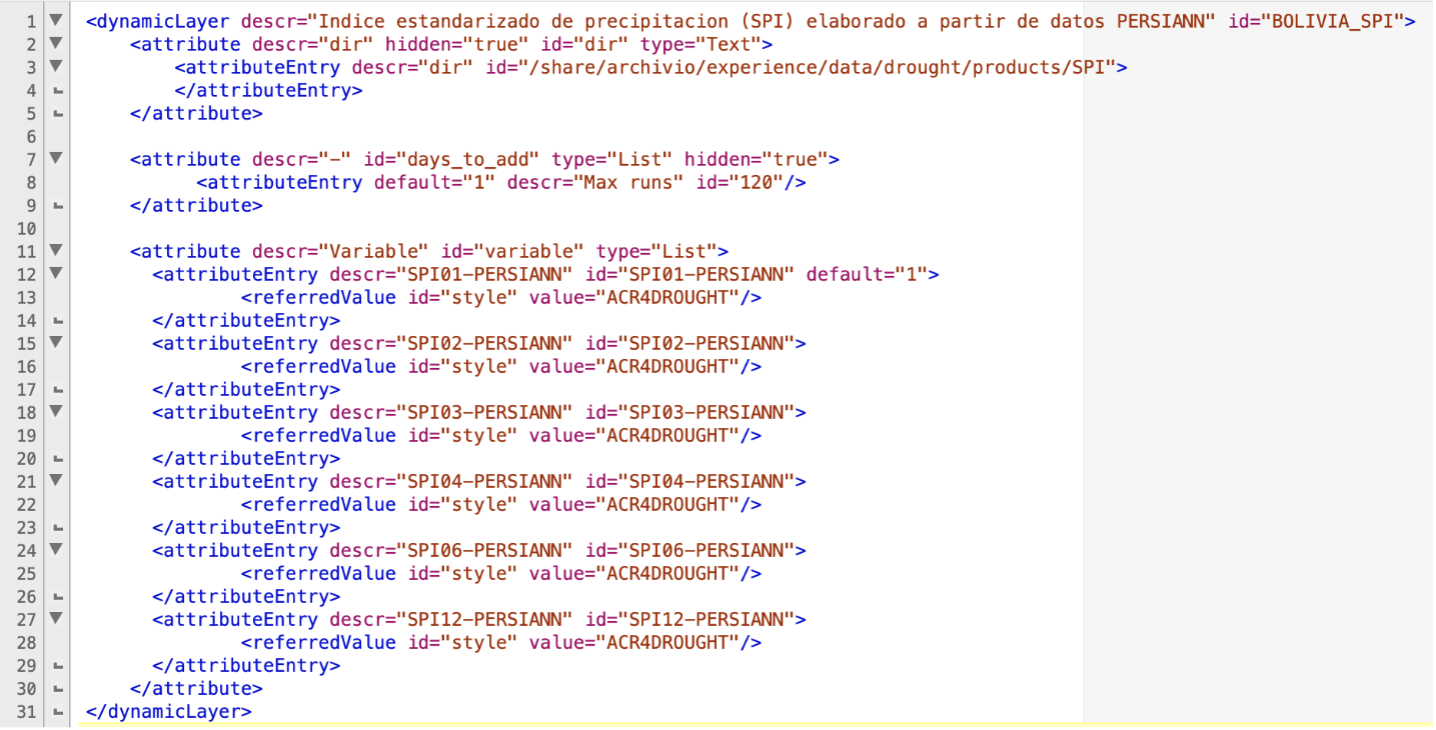
The first step is simply carried out through the configuration of an .xml file, where the name and variable of the index, its location on the server and the style of the Geoserver to be used are specified (see code and example below)
<dynamicLayer descr="[NAME]" id="[NAME]">
  <attribute descr="dir" hidden="true" id="dir" type="Text">
		<attributeEntry descr="dir" id="[DIR]">
		</attributeEntry>
	</attribute>
	<attribute descr="Variable" id="variable" type="List">
		<attributeEntry default="1" descr="[NAME]" id="[NAME]">
			<referredValue id="style" value="[LEGEND]"/>
		</attributeEntry>
	</attribute>
</dynamicLayer>
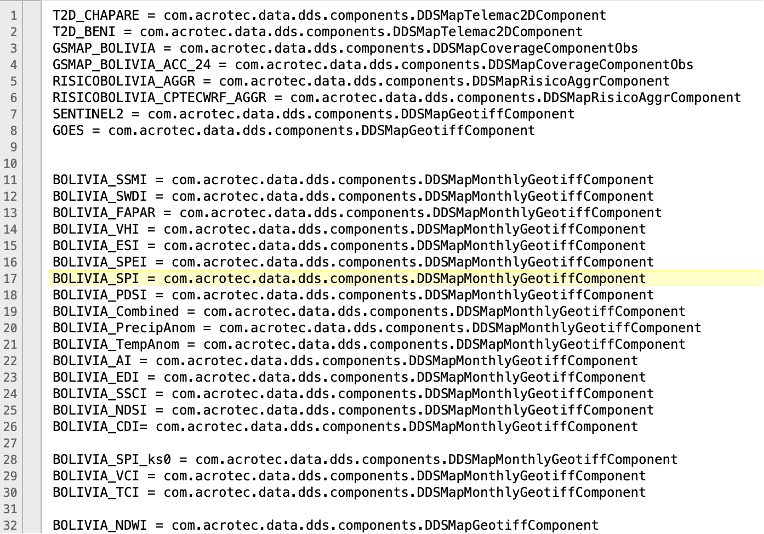
As a second step, it is necessary to specify which component should be used by the system to interpret the data. By means of specific software components, the Dewetra platform allows the reading of most of the commonly used static and dynamic geographic data formats (.tif, geojson, .shp, .grb, .netCDF, etc.). The component to be used, chosen among the available components, has to be specified in the text file "components.properties". For example, in case of a dataset as the global SPI (a drought monitoring index) composed by .tif files updated every month, the component to be used is called "com.acrotec.data.dds.components.DDSMapMonthlyGeotiffComponent".
Therefore, in the “components.properties” text file the following line should be added:
GLOBAL_SPI = com.acrotec.data.dds.components.DDSMapMonthlyGeotiffComponent
As a final step, the product should be published in Dewetra. This can be done through Django (see next section), having created a server for the local DDS.
¶ Publication on Dewetra, using Django
To publish layer on Dewetra, the service manager Django should be used for configuration, so that the information layer appears among the layers made available in the platform. This functionality is implemented through the Dewetra 2.0 Service Manager page called "Django", a back office application developed through the "Django" web framework.
In the Django application for publishing layers on Dewetra platform (image below) it is possible to define, in addition to information such as the name of the layer, the location, the type of layer, the name of the server, the tags (referred to the ones used to group layers on Dewetra platform), group of users that can view that layer, paths and category of the layer.
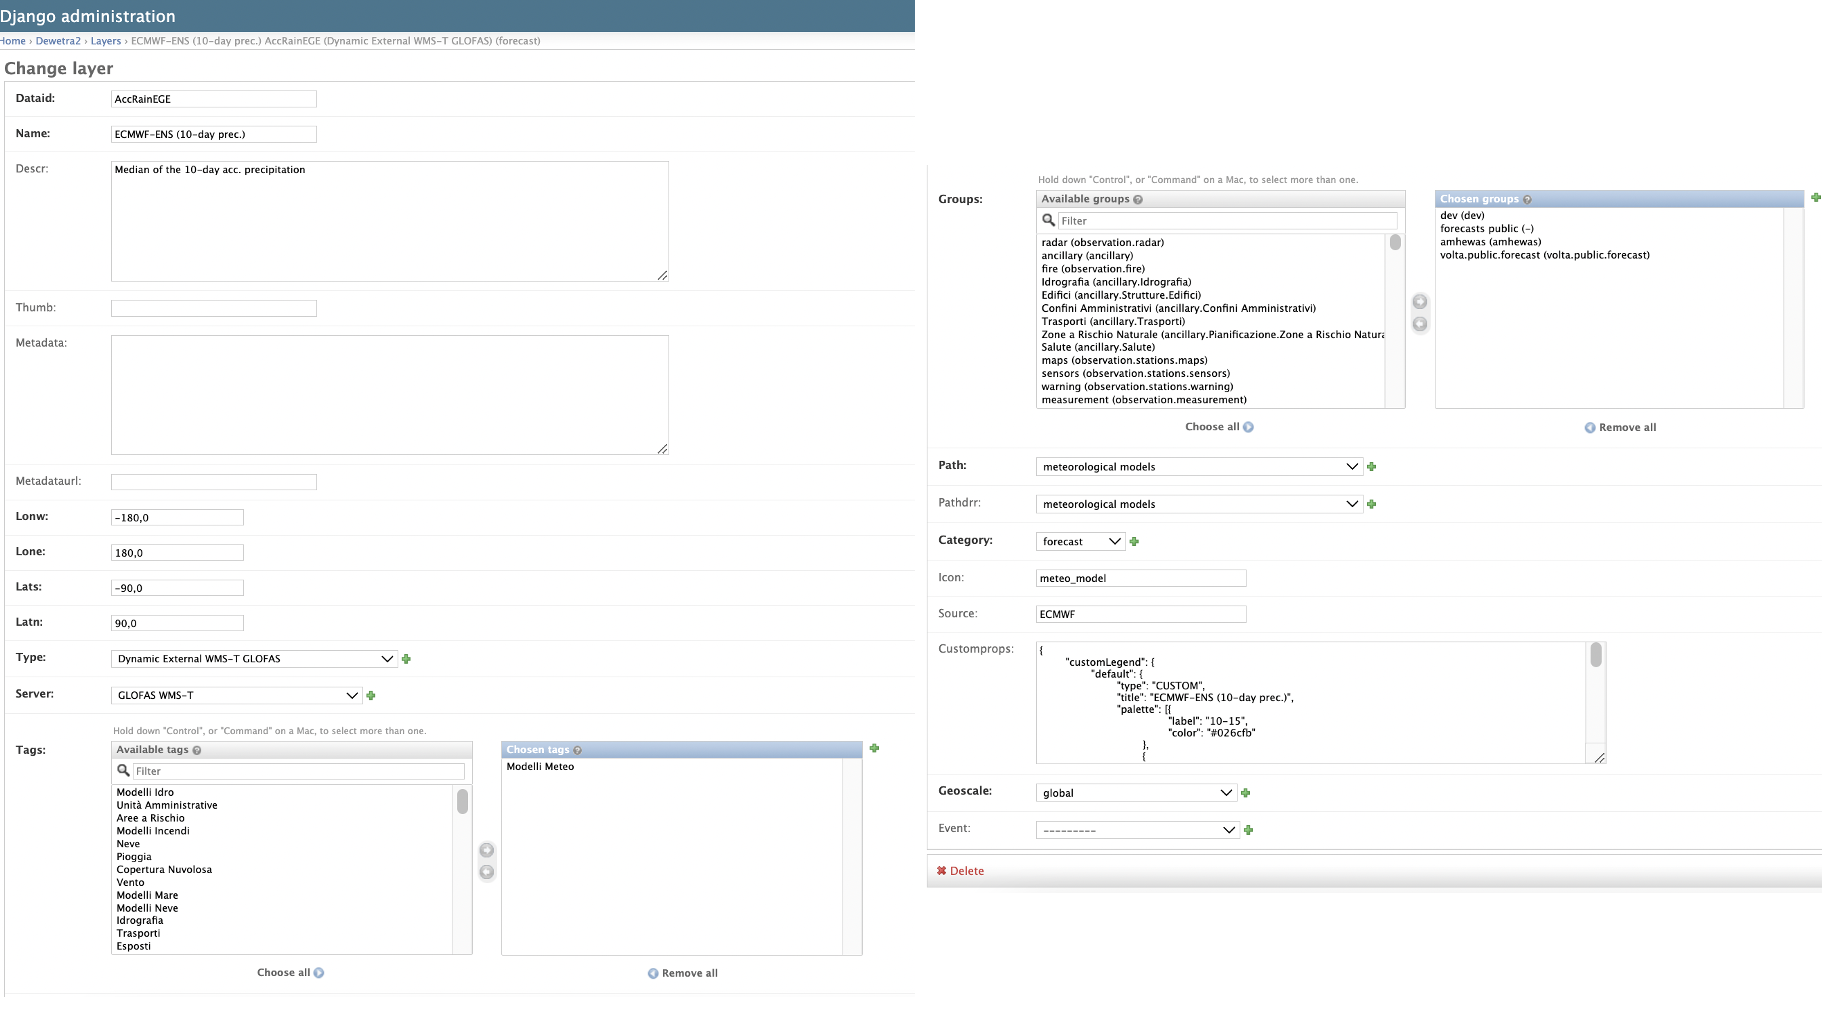
To publish a static or dynamic products using Django, the following steps should be carried out:
- Setting the “Dataid”, which need to be equal to the name of the layer in the component (if dynamic) or geoserver (if static)
- Defining the "Name", which will appear in Dewetra in the layers list
- Provide a description in the “Descr” section
- Include Metadata and related url, if available
- Define the bounding box, which will be used by the “Zoom to layer” function:
- Lonw = Longitude West (-180, 180)
- Lone = Longitude East (-180, 180)
- Lats = Latitude South (-90, 90)
- Latn = Latitude North (-90, 90)
- Define the “Type”, Static or Dynamic
- Select the “Server” (local or external DDS, WMS)
- Select the “Tags”, defining the position in Dewetra
- Assign the “Groups", the user who can see the layer (see admin tool guide for further info)
- Assign the “Path” and “Pathdrr”, for folder style position in Dewetra
- Define the “category”, macro-group for the layer: Observation, Forecast, Static Data
- “Icon”, select the icon for the layer. Names available here, “i-” prefix should be removed: https://mydewetra.cimafoundation.org/portals/commons/dewetra_fontset/dewetra/ico_layer.html
- Indicate the “source” of the product, it will appear in the icon in Dewetra.
- Indicate the geoscale, local, global or custom.
[Home]