[Home]
The frontend solution based on DEWETRA is requested by the project to met a series of requirements, reported in the section below “Frontend requirements and expectations”. A set of step-by-step commands has been drafted for testing these requirements, reported in the section below “Testing”.
¶ Frontend requirements and expectations
- The user interface will be available in commonly used web browsers.
- The user interface will be web based.
- The user interface is intuitive and user-friendly.
- The portal supports user-id/password authentication for advanced usage of the portal including user profiles.
- Datasets can be visualised in graphs, tables and maps.
- Multiple map datasets can be overlayed
- Map opacity can be set through a dedicated slider.
- The map display contains features for zoom in, zoom out and panning the map.
- Datasets can be exported in CSV, GeoTIFF or Shapefile formats.
- The portal will be able to provide public access with no authentication to selected data on current warnings, if required.
- Datasets are listed in categories and can be selected from the categorised list.
- Different map layers are available and can be selected as background map (e.g., Open Street View or satellite imagery).
- The map display supports the selection or filtering of objects.
- The map display presents a selection of metadata in a tooltip.
- The dashboard of the user interface can present a preview of selected datasets.
- The portal has a data keyword search function.
- The time window for the visualisation of datasets in graphs or maps can be changed (smaller, larger and to another period).
- The portal support on-the-fly data aggregation (both spatial and temporal)
The frontend solution based on DEWETRA will be potentially able to integrate and visualise the following information and products, once available and if provided in standard formats (e.g., GeoTIFF, Shapefile, Geojson, Netcdf, Grib):
Meteorological observations (timeseries and grids)
- Weather satellites
- Radar products
- Hurricane products
- Hydrological observations (timeseries)
- Weather forecasts.
- Hydrological model forecasts, including timeseries and grids.
- Drought products
- Warnings
Background maps and ancillary information:
- Geometry of:
- Location of measurement stations, including sensor coordinates
- Rivers
- Roads
- mportant objects
- Digital Elevation model (DEM), at multiple scales
- Contours of geographical areas, e.g., river catchments
- Orthophotos
- Land use
- Satellite derived landcover data (raster)
¶ Testing requirements
The following commands allows to test the functionality of the system, according to requirements and expectations:
- Requirements 1, 2, 3, 4
Access the Dewetra platform using Chrome and/or Firefox at https://stlucia.mydewetra.cimafoundation.org/
Note: credentials given separately.
- Requirements 5, 6
Enter in Dewetra from the dashboard (Access to the platform)
In the upper bar select static → basic → LCA DEM
In the upper bar select static → basic → LCA Quarters
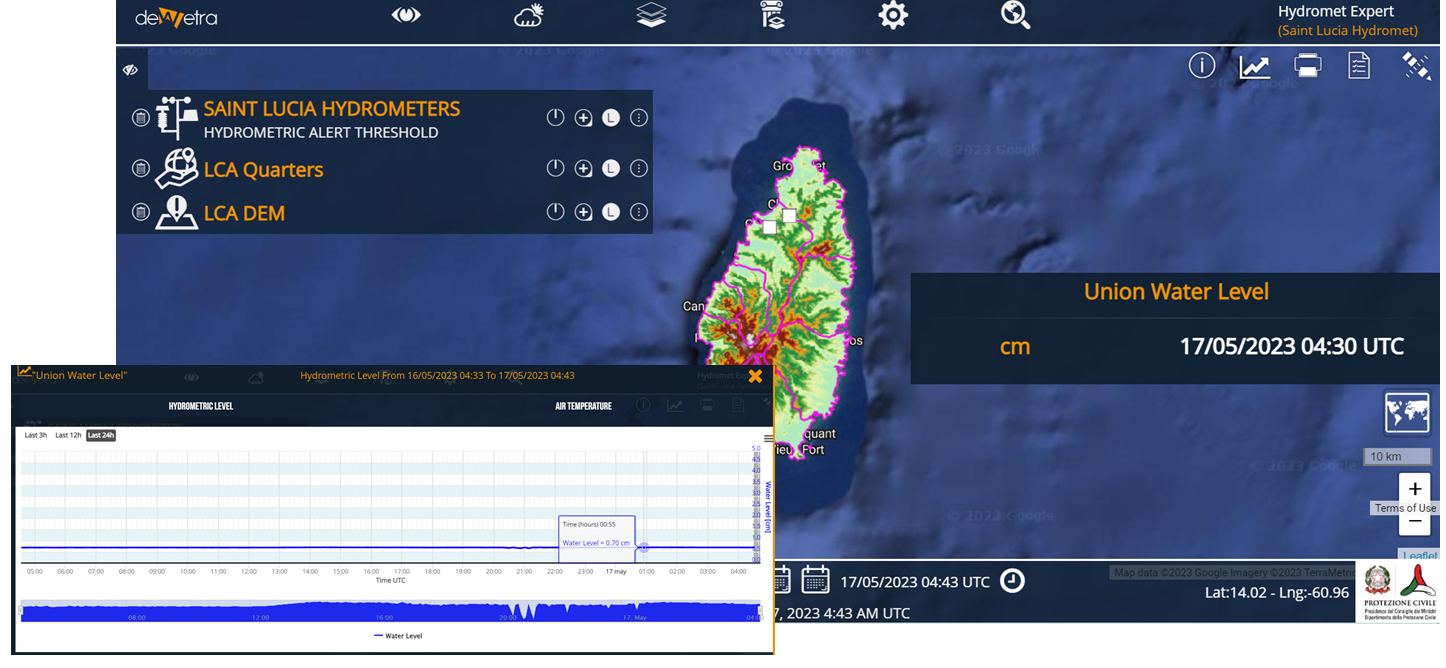
In the upper bar select observations → water levels → Saint Lucia Hydrometers
Click on Union Water Level point to visualise the graph.
3 different layer, raster, vector and a graph, are overlaid (order can be changed using the mouse).
- Requirement 7
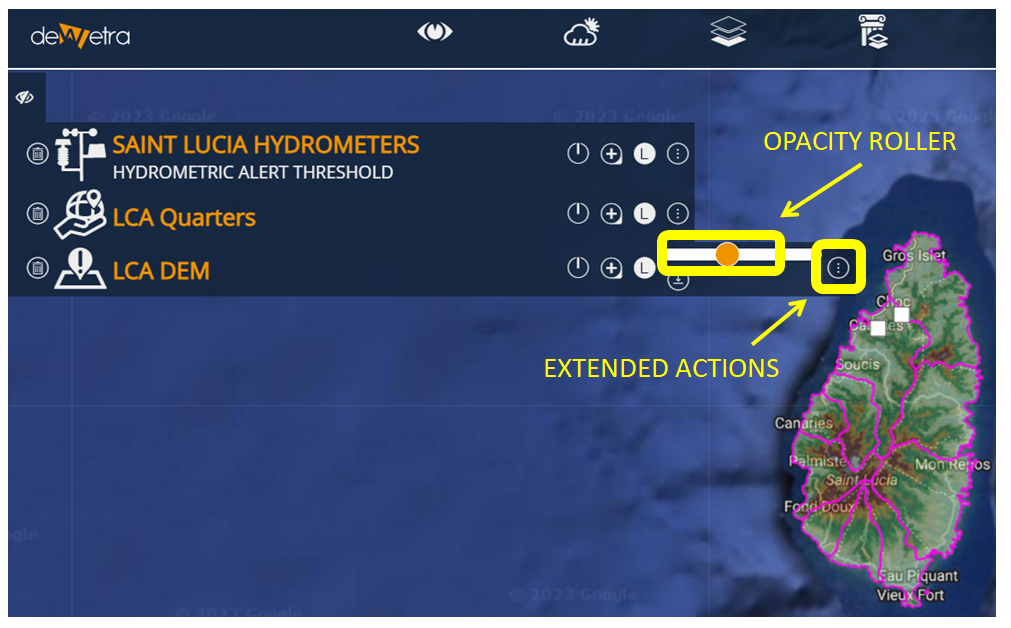
Click on the 3 dots on the right side of the LCA DEM layer
Use the roller to set the opacity of the layer
- Requirement 8
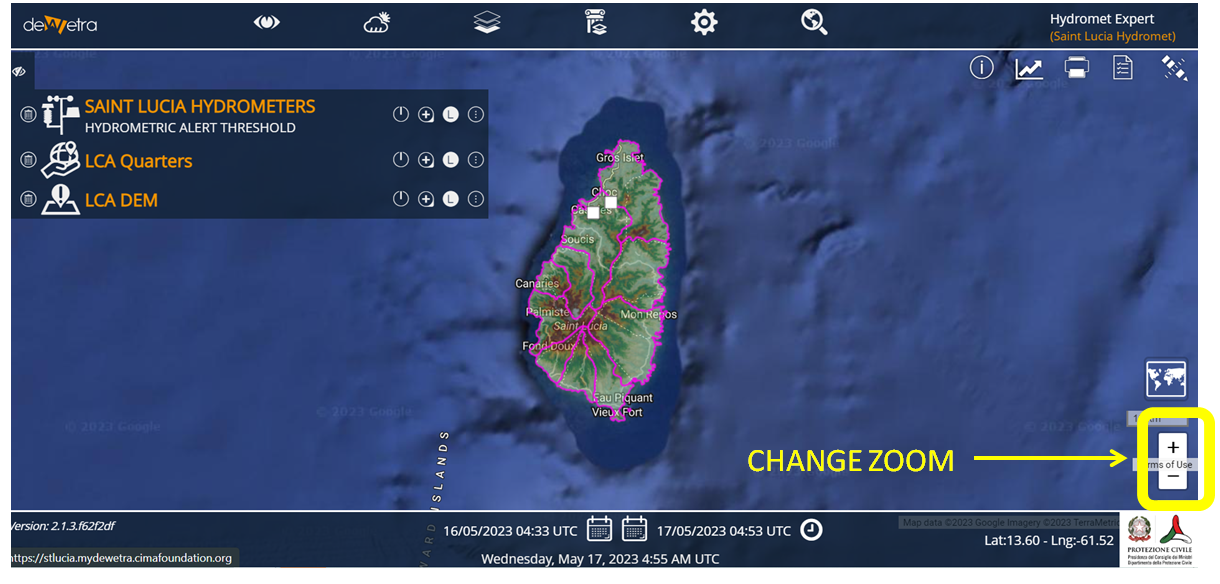
On the lower right side, 2 buttons to change zoom settings are available.
- Requirement 9
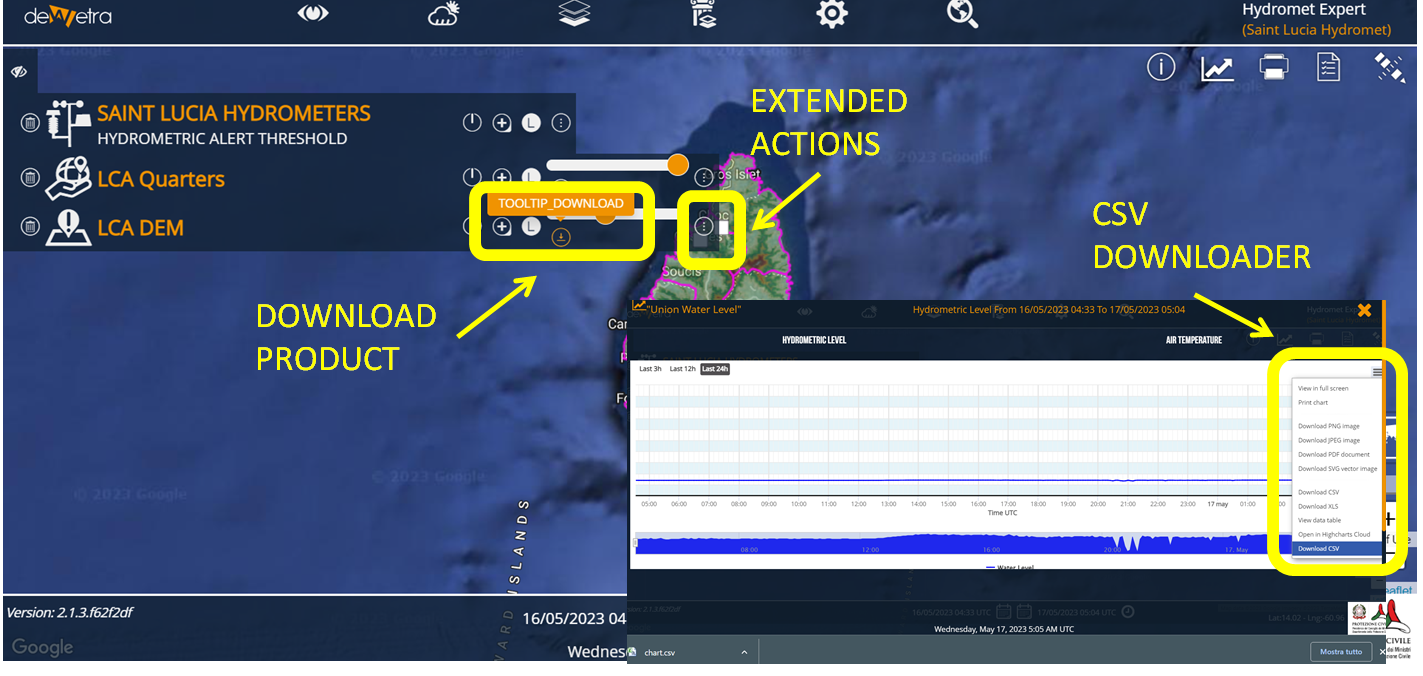
Click on the 3 dots on the right side of the LCA DEM layer
Select download to your computer, a tif file will be downloaded
Repeat the operation for the LCA Quarters layer, a shapefile will be downloaded
Click on the Union point of the water level layer, a graph will prompt. Click on the three lines in upper right side of the graph, and select download as csv.
- Requirement 10
Visit https://stlucia.mydewetra.cimafoundation.org/hydromet_portal/#/
- Requirement 11
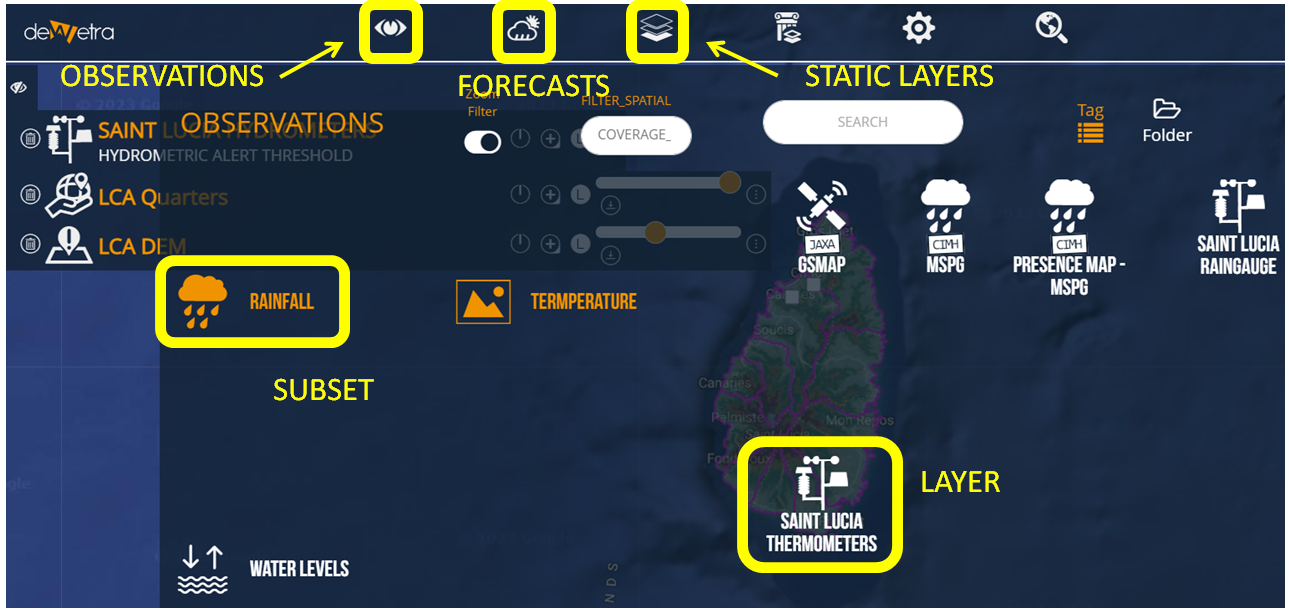
In the upper bar, datasets are organised in 3 main categories: observations, forecasts, static layers. Each category has subsets, organised in “Tags”. By using the mouse, the data tree can be explored.
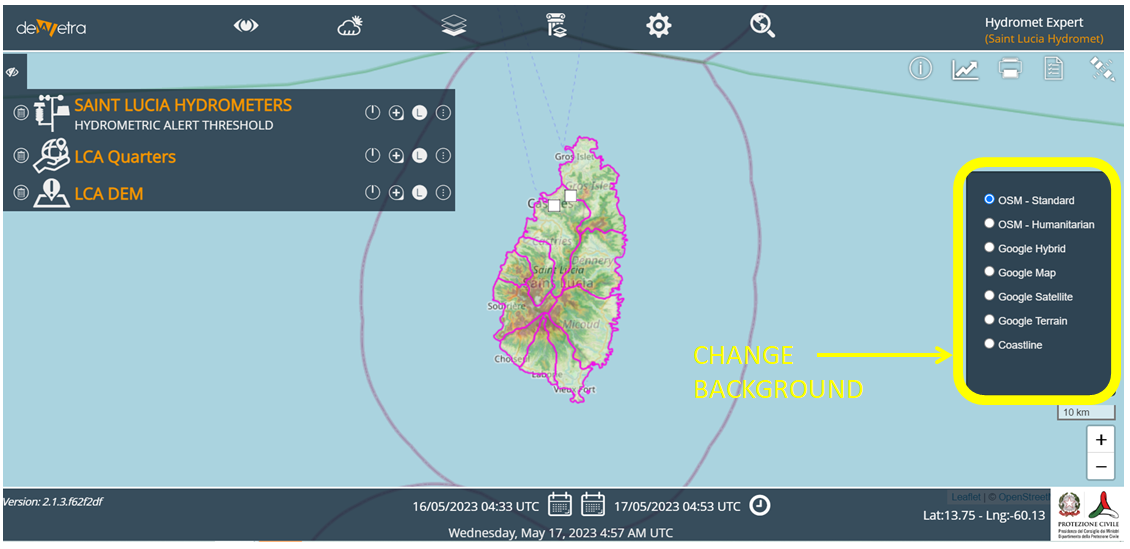
- Requirement 12
On the lower right side, a button allows to select between multiple background (Google or OSM)
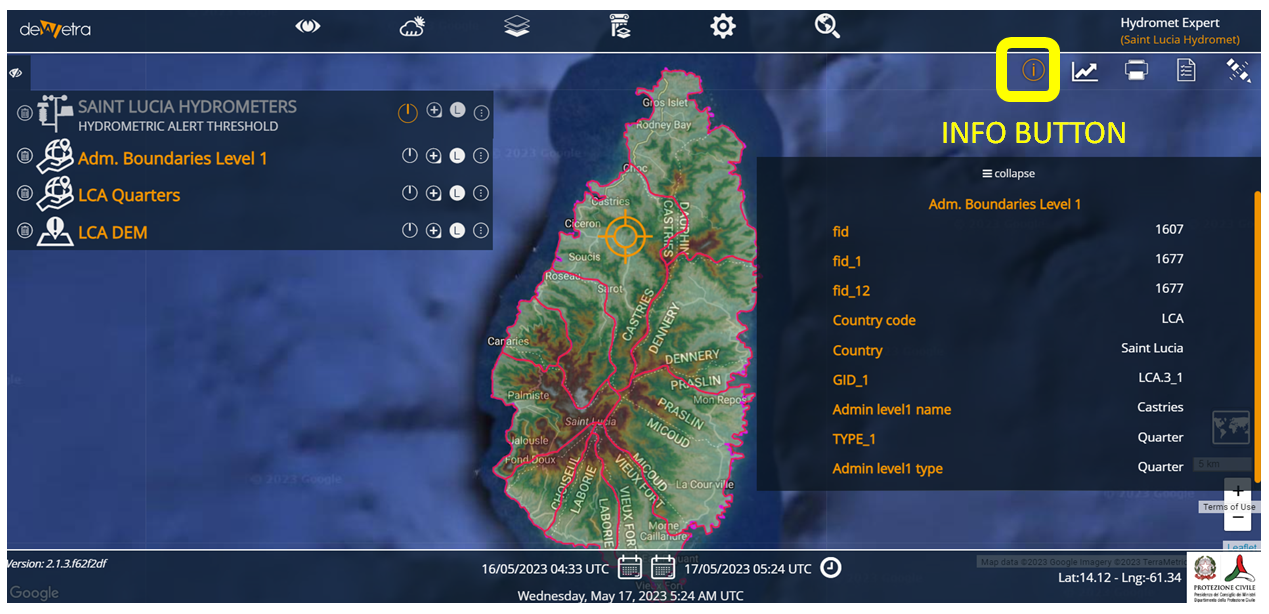
- Requirement 13, 14
In the upper right side, the (i) button allow to select and interrogate a single layer.
Use the (i) button to check the height on the LCA DEM layer.
A tooltip will prompt on the right side, providing the value and metadata at the selected point.
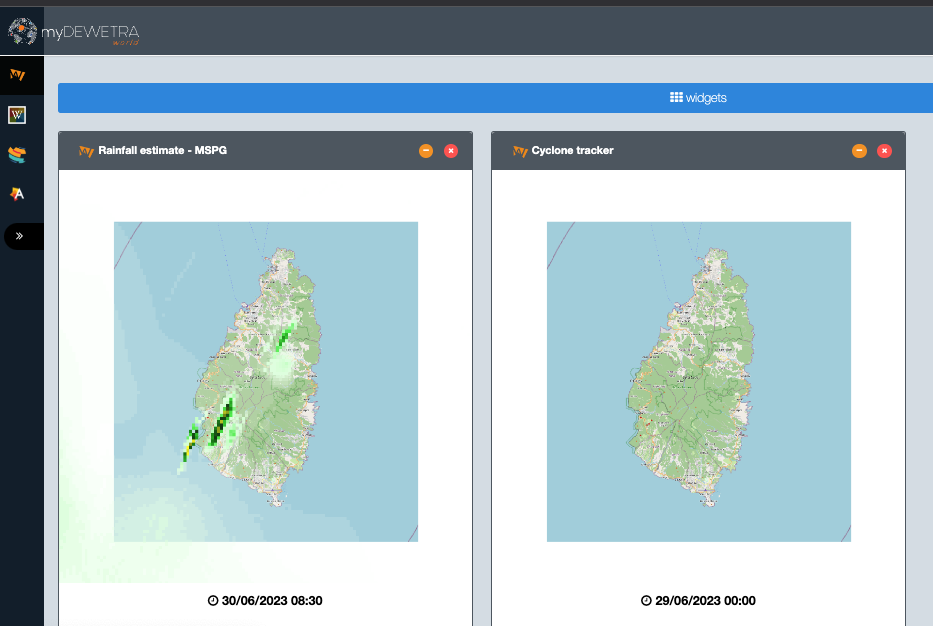
- Requirement 15
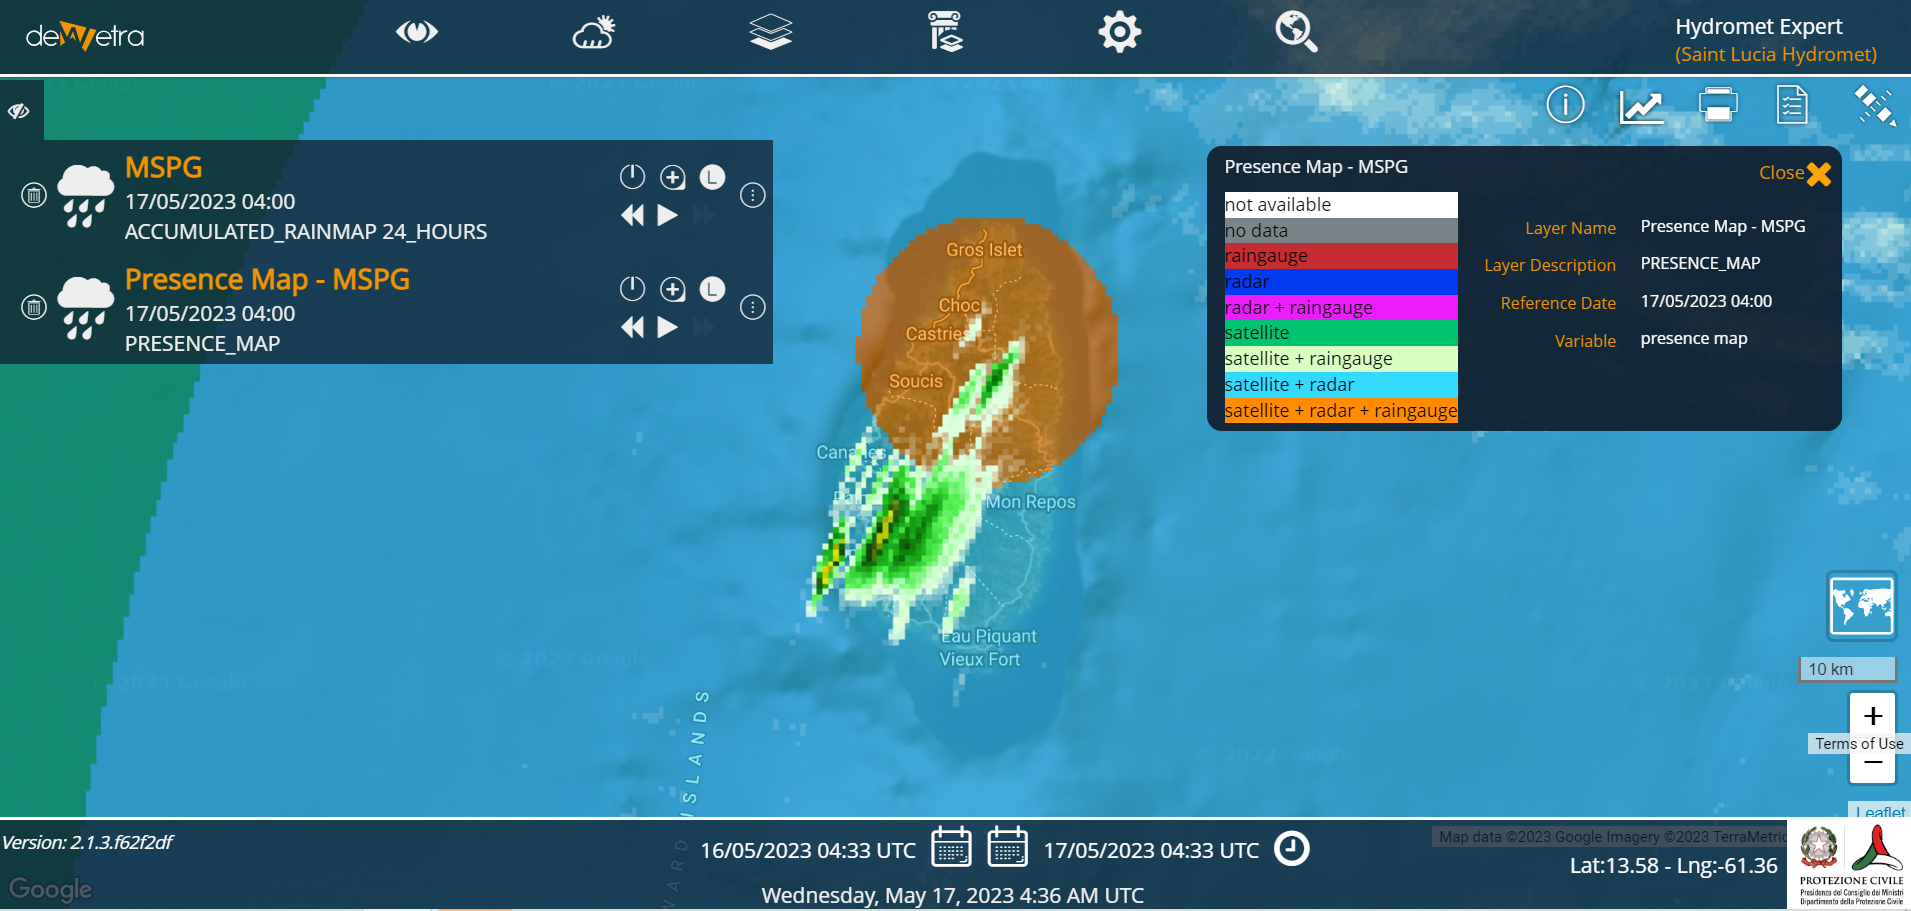
The dashboard has a widget function for this purpose. Currently, Multi-Sensor Precipitation Grid and Cyclone Tracker tools are set as widgets.
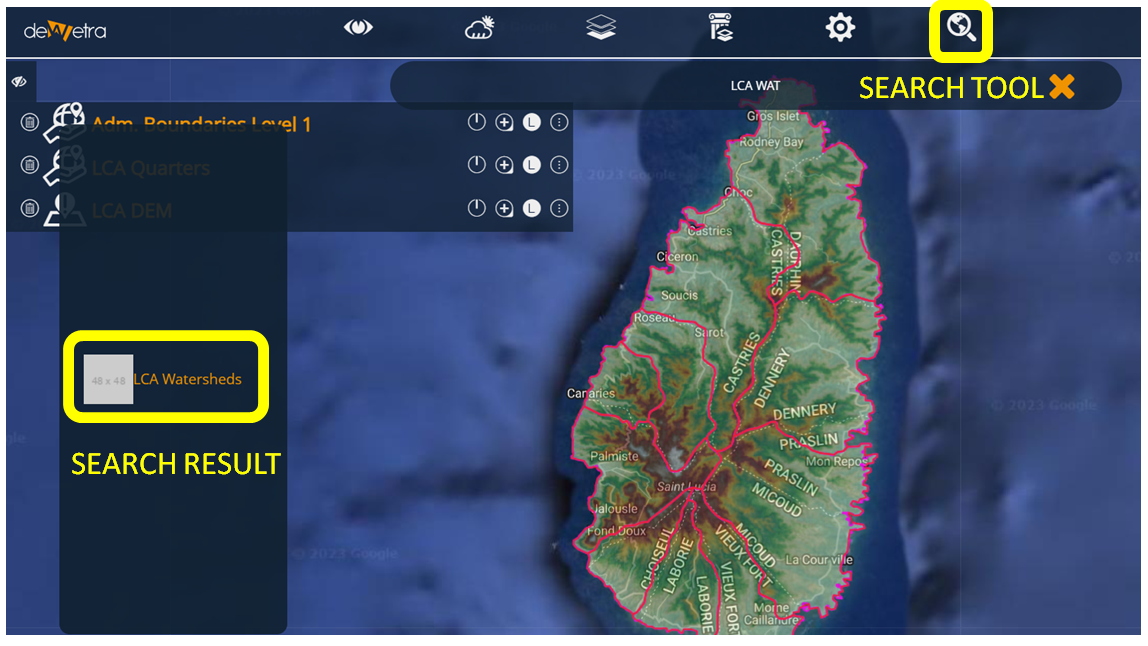
- Requirement 16
In the upper bar, select the magnifier and search for LCA Watershed.
Select the query result to visualise the data.
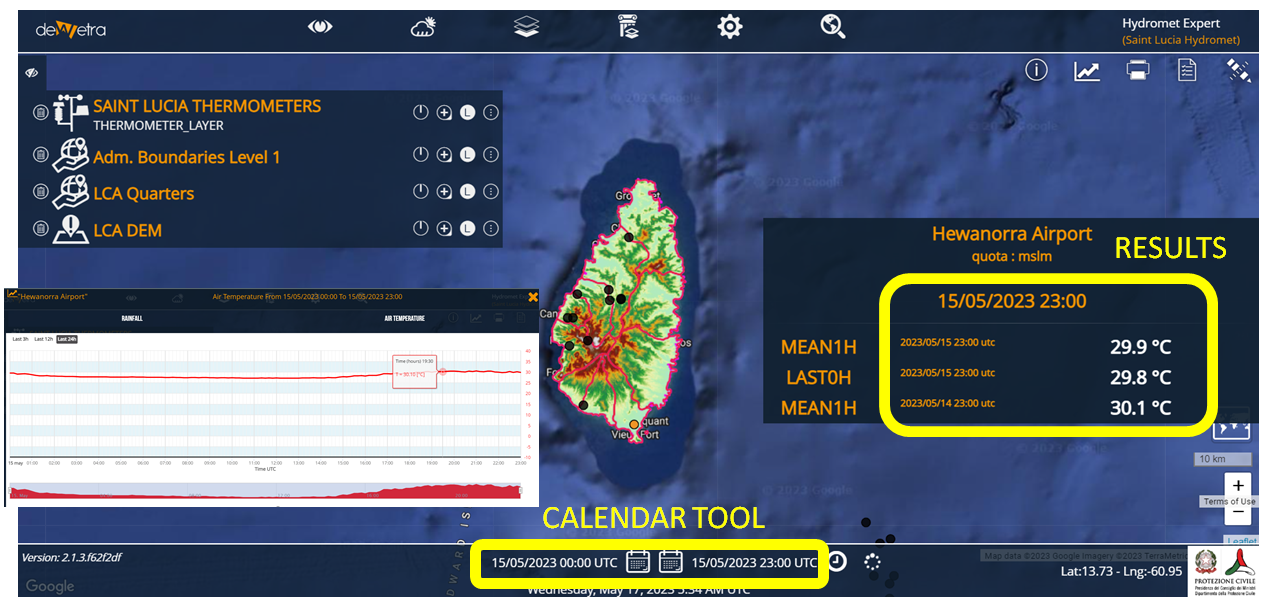
- Requirement 17
In the lower bar, change the left calendar to 15 May 2023 at 00:00 (Date from)
In the lower bar, change the left calendar to 15 May 2023 at 23:00 (Date to)
In the upper bar select observations → temperature → Saint Lucia Thermometers
Click on Hewanorra point to visualise the graph.
Data displayed are the one of the selected time period.
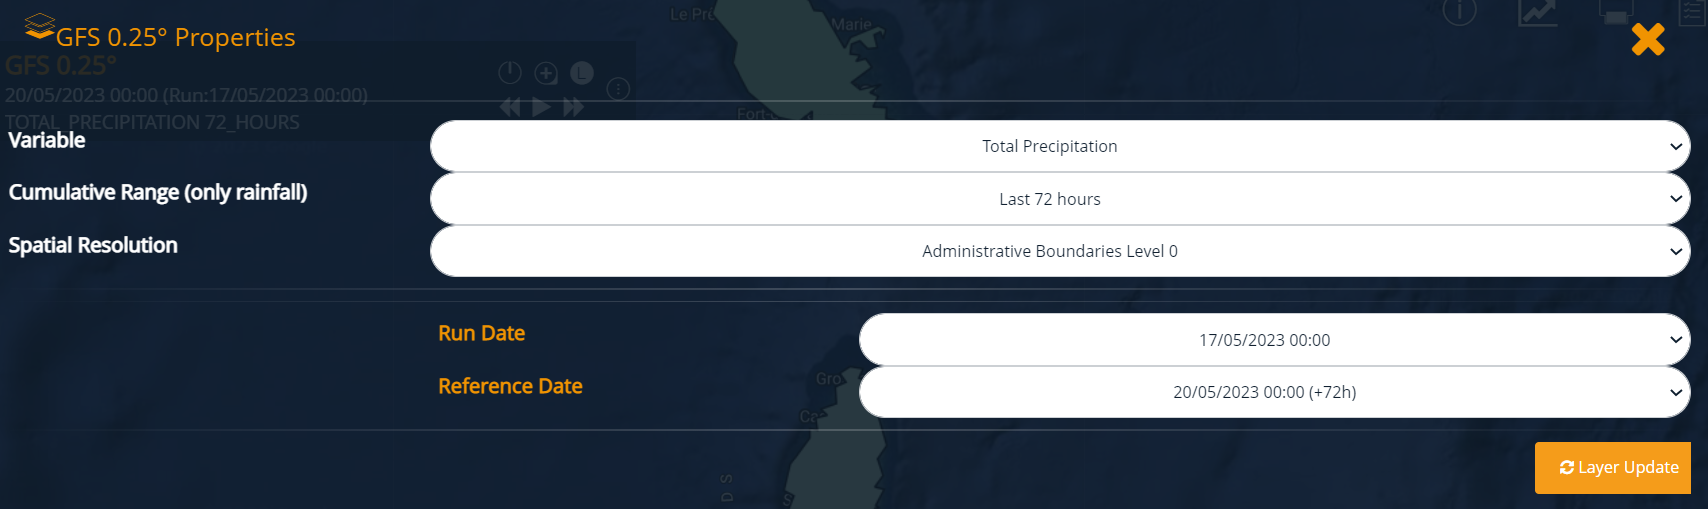
- Requirement 18
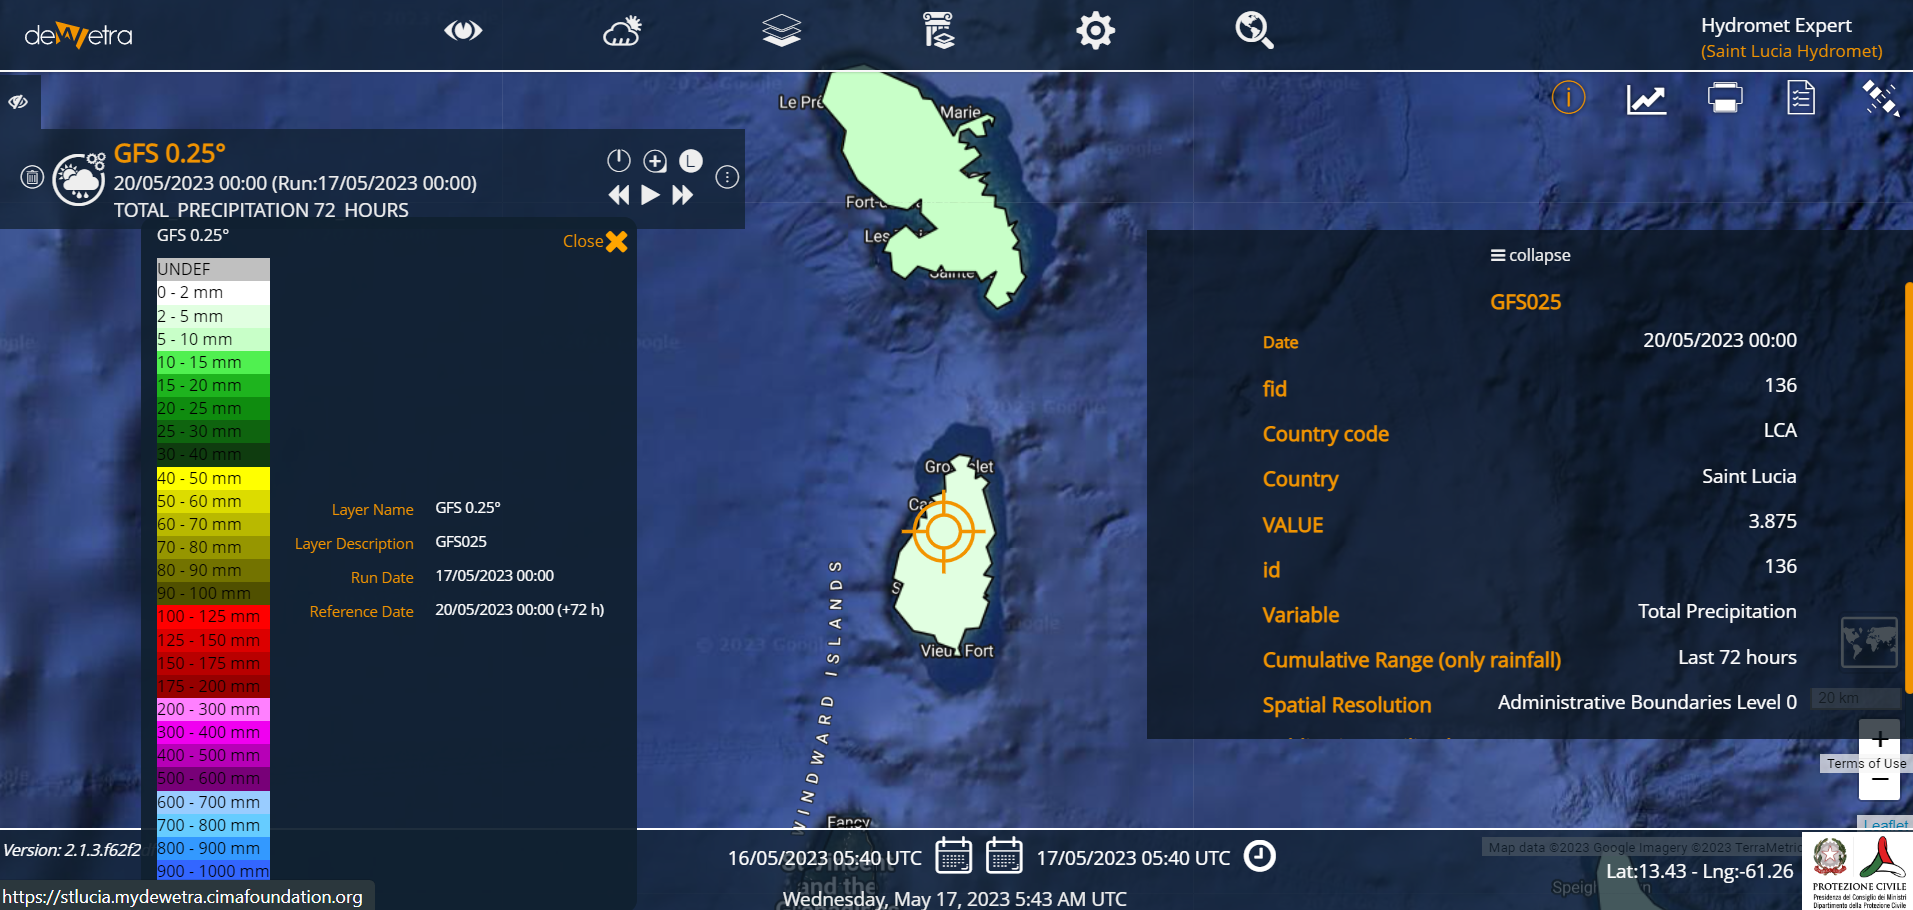
In the upper bar select forecasts → meteorological model → GFS 0.25
Click on the layer name in the layer list
Set layers properties:
- Select rainfall as variable
- last 72h as cumulative range (temporal aggregation)
- Administrative Boundaries Level 0 (as spatial aggregation)
- Current date (last available model)
- Reference date +72h
¶ Testing system functionalities on the front-end server
Specific actions can be undertaken to test the correct functioning of the system on the front-end server. To perform these tests, administrator user should enter the front-end server as root using the given IP and the VPN connection. Access should be via secure shell, with keys, using a terminal application (e.g., Putty for Windows, Terminal for MacOS).
- Monitor the correct operation of the system
Open a terminal application (even outside the VPN)
In the command line, type:
wget https://admin:geoserver@stlucia.mydewetra.cimafoundation.org/dds/rest/ddsserie/supported -O /dev/nullCommand result should report:
HTTP request sent, awaiting response... 200
Where response 200 means “OK”
- Monitor the correct acquisition of data from the back-end
Open the terminal application, enter the server as root
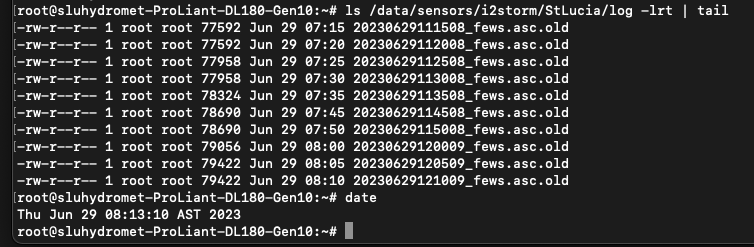
In the command line, type:
ls /data/sensors/i2storm/StLucia/log -lrt | tailCheck the timing of the listed file, to match (+/- 1 hour) the current time of the server (which can be checked typing “date” in the command line).
- Monitor the correct acquisition of data from the back-end
Open the terminal application, enter the server as root
In the command line, type:
curl "http://fews:8080/FewsWebServices/rest/fewspiservice/v1/timeseries?startTime=2023-05-30T00:00:00Z&endTime=2023-06-01T00:00:00Z"Check the timing of the listed file, to match (+/- 1 hour) the current time of the server (which can be checked typing “date” in the command line).
A series of data should appear.
¶ Testing the public portal
Specific tasks can be undertaken to test the public portal.
- Testing access
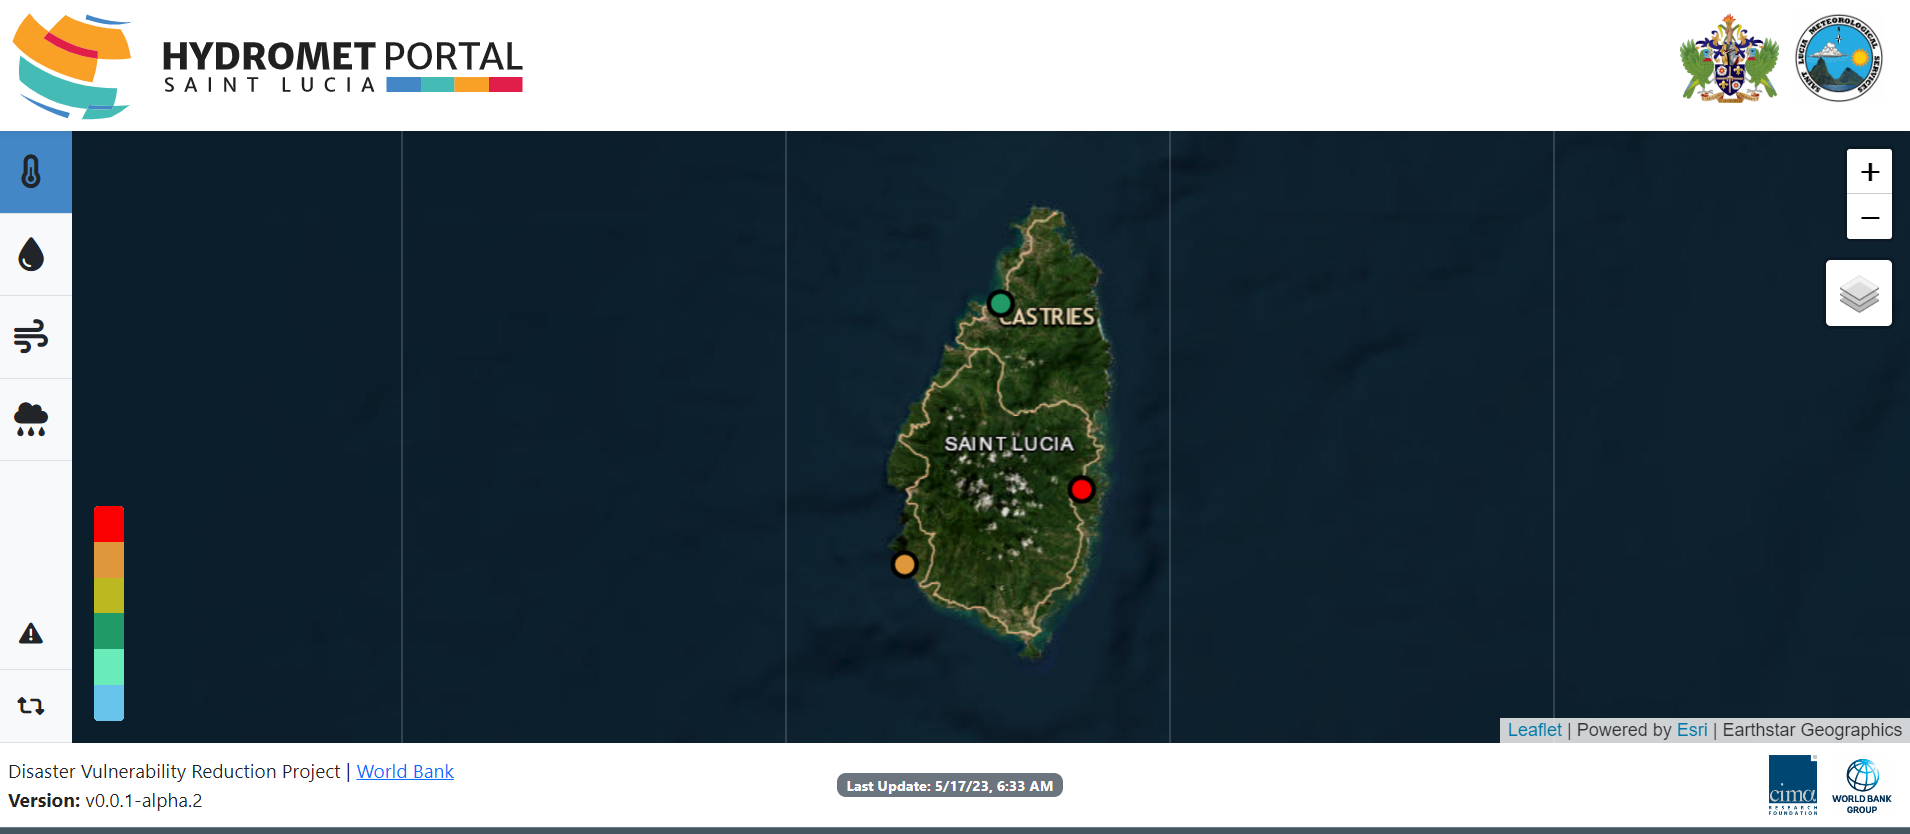
Type or copy the url: https://stlucia.mydewetra.cimafoundation.org/hydromet_portal/#/
A map centred on Saint Lucia should appear.
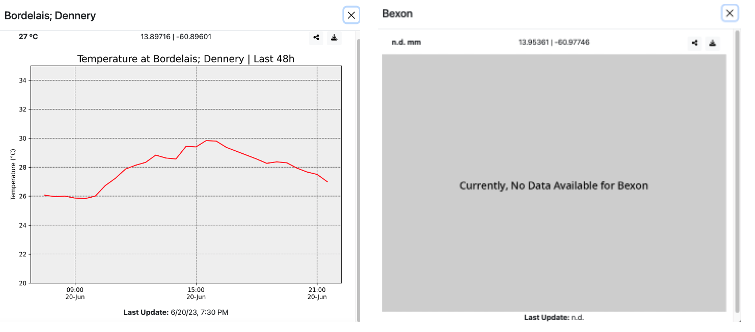
- Testing observation records
Click on the thermometer icon on the left, the map showing the thermometers location should appear.
Click on a specific point, if data are available a plot should appear in a pop-up window. If not, an image with written “no data available should appear”.
- Testing share records
Click on the share icon on the top-right of the pop-up window.
Select share using whatsapp
A new page should open requesting to access whatsapp.
Link to the plot can then be shared directly through a whatsapp chat:
¶ Further data and functionalities
Finally, concerning the expectations on the potentialities to integrate additional data, Dewetra is currently integrating local data provided by GoSL and data from forecasts available at the global at regional level. Specifically:
- WRF meteorological model from CIMH
- GFS meteorological from model NOAA
- 10 days precipitation forecast from ECMWF
- Cyclone Tracker from TCGP
- Multi Sensor Precipitation Grid from CIMH
[Home]