[Home] - [Access to the platform] - [User Interface] - [Observations] - [Forecast Models] - [Static Layers] - [Events] - [Tools]
The fourth action button of the Toolbar is the Events menu, which provides access to the time-independent data related to natural disasters happened in the past.

When users press the Events button, the system displays the “timeline” in the lower part of the screen and the available datasets on the map (see the figure below)

¶ 1. Map Viewer
When clicking on a specific icon (earthquake in the example), a list of the available layers for that specific event is displayed
To display a specific dataset, click on an item of the list
¶ 2. Timeline
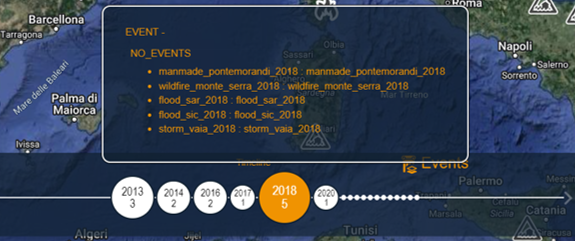
The timeline allows to select a specific year and/or month to analyse the events that have taken place in that timeframe: in this example, for year 2018, 5 events are stored in the database
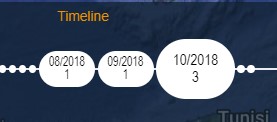
If the 2018 balloon is clicked, the user is then allowed to see in which month the events happened: in this example, 1 occurred in August, 1 in September, and 3 in October
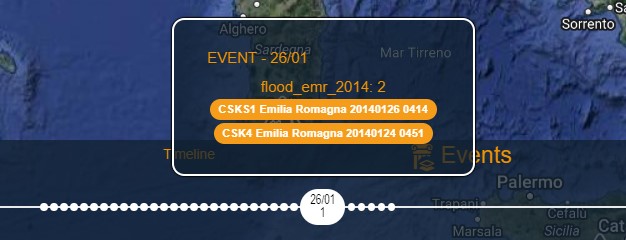
If the month ballon is clicked (e.g., October), then events are shown in the day they took place (2 on October 10th, 1 on October 26th)
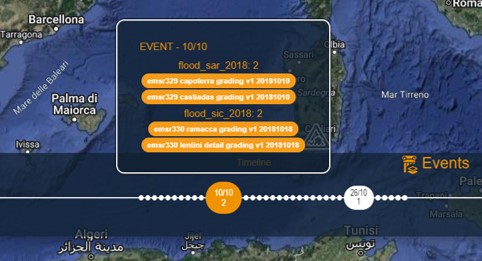
At this stage, the user can eventually display a single layer by clicking on its label.
Please note that, as the user refines the search criteria, the Map Viewer is updated accordingly
¶ 3. Filters
In the lower right corner of the screen the user has the possibility to filter the available dtaset depending on:
- 3a: the data type (e.g., cyclone track, grading maps, flooded areas, burnt areas)
- 3b: the hazard type (e.g., tropical cyclone, earthquake, flood, forest fires et c.)
By default all data types are shown, the user can refine the search criteria by clicking the X button on the top right of each balloon
Please note that, as the user refines the search criteria, the Map Viewer is updated accordingly
[Home] - [Access to the platform] - [User Interface] - [Observations] - [Forecast Models] - [Static Layers] - [Events] - [Tools]