[Home] - [Access to the platform] - [User Interface] - [Observations] - [Forecast Models] - [Static Layers]
The first action button of the Toolbar is the Observations menu, which provides access to all the observational datasets to the user. Once the user clicks on the menu, two different views are offered: the Tag and Folder mode. The Tag mode shows the observational data as organised by thematic criteria, as shown in the following table.
| Tag | Layer |
| Rainfall | Saint Lucia Raingauge |
| GSMaP | |
| MSPG | |
| MSPG Presence Map | |
| Temperature | Saint Lucia Thermometers |
| Water Levels | Saint Lucia Hydrometers |
Every time a layer is pulled on, the application uploads it in the Control Map and the Layer List (top left of the screen). If the cursor is left on the name of the layer in the Layer List, the user enables the tooltip function to open two windows:
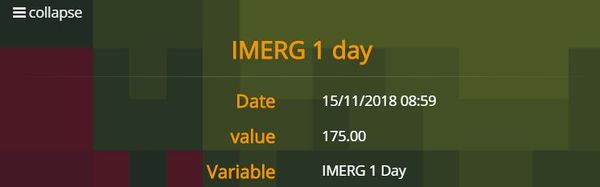
- the first one at the top right of the screen which shows the metadata of the layers, such as:
- the name of the layer
- the Layer description
- the reference date
- the initialization time of the run (if the chosen layer is a model's output)
- the Spatial aggregation (if enabled)
- the validity interval (if it is a combined variable)
In the given example, the tooltip displays the available information about the IMERG dataset.
2. the second one is placed immediately to the right of the Layer List and shows the date of initialization of the run (if the case) and/or the reference date. In the following example, a tooltip appears to the right of the Layer List for the rainfall map.

To the left of the name of the layer listed in the Layer List users find the trash-can icon by means of which the previously loaded layer can be deleted.
To the right to the name of the layer the system offers to the user a set of buttons:
- Turn on / Turn off visualizes / deletes a previously loaded layer
- Zoom to Layer allows the user to bring the zoom back to the default level for that layer
- Legend displays the pop-up window showing the legend for the selected layer
- Scroll offers the user the option to display a set of successive time steps of a given variable within the time range set in the Display)
- Expand allows to display the buttons that activate some additional functions such as:
- the slider adjusts the transparency / opacity of each layer
- the download button saves to user's own disk any chosen layer, in many formats
- the refresh button updates the layer, by loading the latest version from the available
- the metadata button that allows the user to view / download the metadata file associated to the layer
Below the name of the layer, users find the play/pause', the rewind and the fast forward buttons by means of which they can move forward(backward) to next(previous) entry of the timeseries, if available.

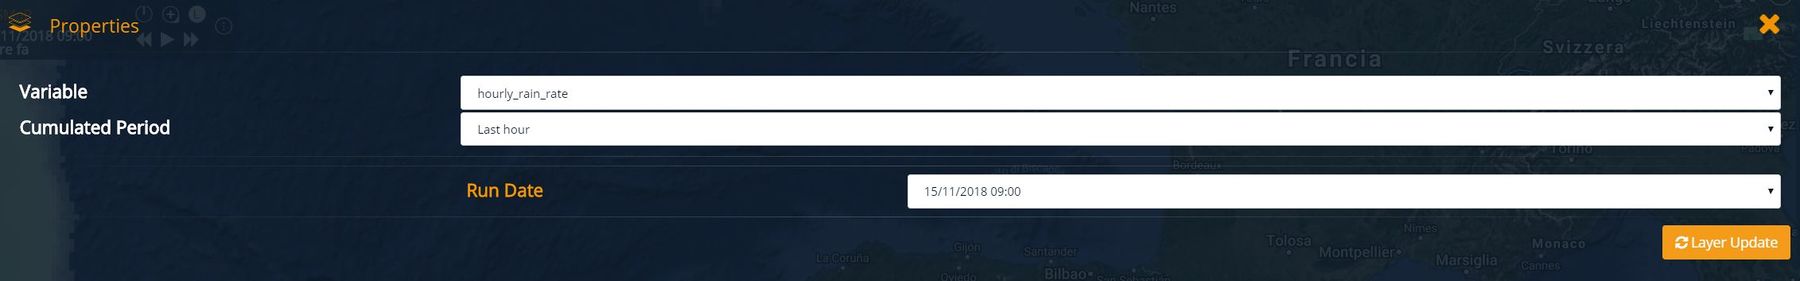
By left-clicking on the layer's name users are prompted to a dialog box where they can edit the parameters of the dynamic layer loaded including, for example, the spatial aggregation, the accumualtion period (if the variable is cumulable), the time step, the thresholds the data can be filtered by, the interpolation algorithm of the data (if the varibale is interpolated), et c.
[Home] - [Access to the platform] - [User Interface] - [Observations] - [Forecast Models] - [Static Layers]