[Home] - [Access to the platform] - [User Interface] - [Observations] - [Forecast Models] - [Static Layers]
This section is devoted to give users a deeper insight about:
- Switch Language
- Control Map
- Toolbar
- Display
- Layer List
- Additional Tools
¶ Switch Language
Dewetra is offered in 4 languages:
- English (default)
- French
- Spanish
- Portuguese
- Albanian
- Greek
- Ethiopian
- Italian
To change the default settings, click on your account at the top right corner. A menu will pop up (see figure below).
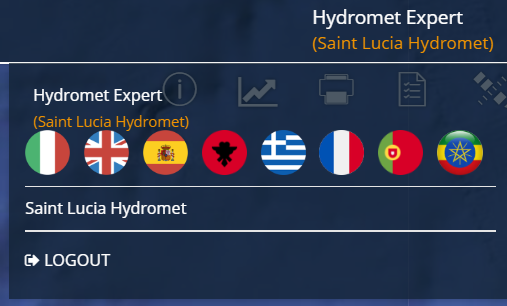
Left-click on the flag corresponding to the language you want to set: the system will update all the labels and menu accordingly.
¶ Control Map
The Control Map of the application is managed by the open source Java script library Leaflet. The control is instantiated as the system is started, using the Google Hybrid map provided by Google-Maps services as the background layer. The available background maps are:
- Google Map: consists of the world political map, toponyms are shown with respect to the zoom level;
- Google Satellite: consists of the world's physical map obtained from the composition of high-resolution satellite images;
- Google Terrain: world physical map in which are graphically displayed mountain ranges, lakes, rivers, depressions, et c.
- Google Hybrid (default): represents the combination of the two aforementioned maps.
In addition to these main options, the user can upload every background map released by open source consortia (eg., OpenStreetMap) such as Standard, Cycle Map, Transport Map, MapQuestOpen, Humanitarian, et c.
The user can select the background map by moving the cursor on the action button located in the lower right of the screen, shown in the following figure:

It is possibile to pan the map by clicking the left mouse button and dragging it to the desired direction. The zoom level may be controlled:
- using the mouse wheel (scroll forward: increases level of zoom / scroll back: decreases zoom level)
- by holding down the SHIFT key on the keyboard and drawing a rectangle with the mouse, holding the left mouse button clicked. In this way, the zoom will be related to the selected area
- by the combination of CTRL and + buttons (Zoom In) or CTRL and - (zoom out)
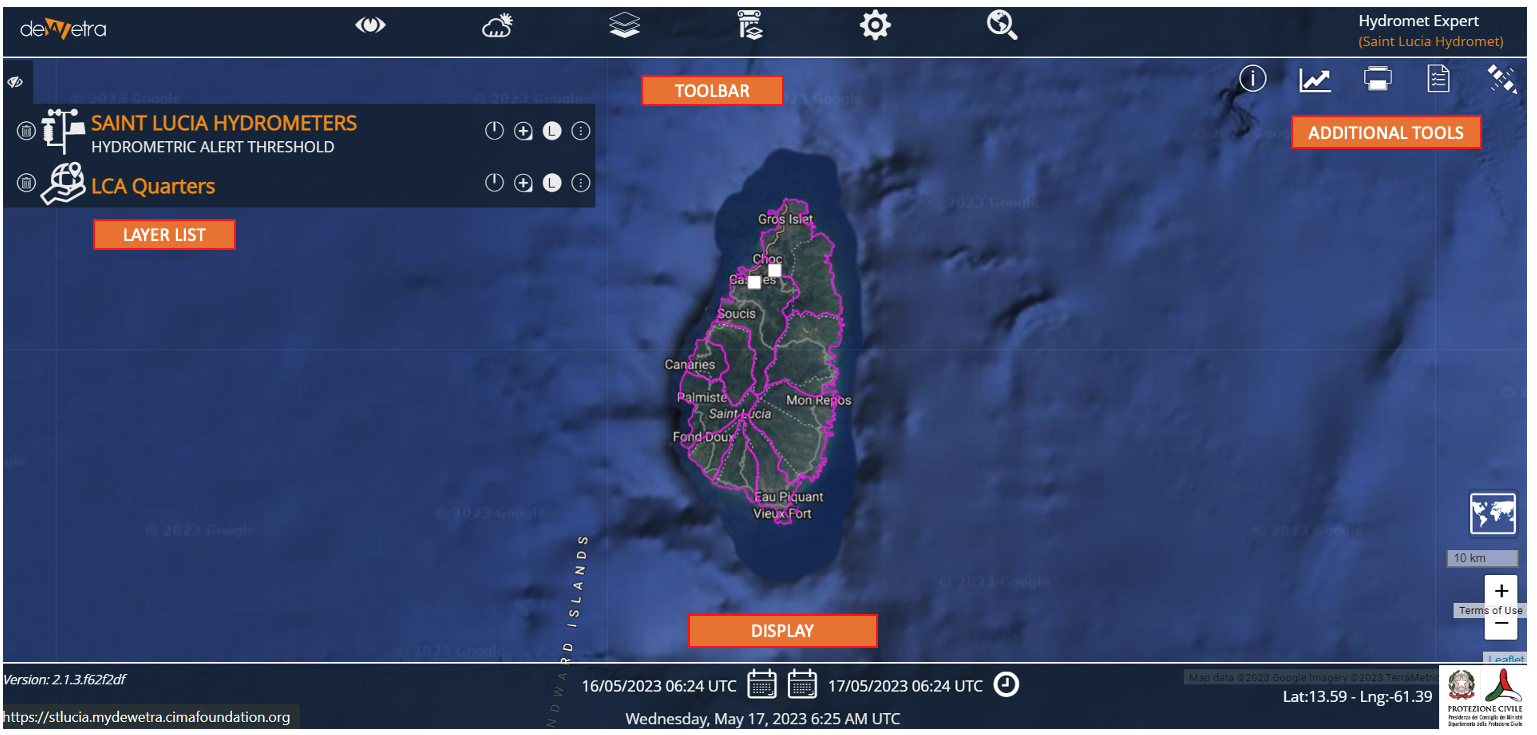
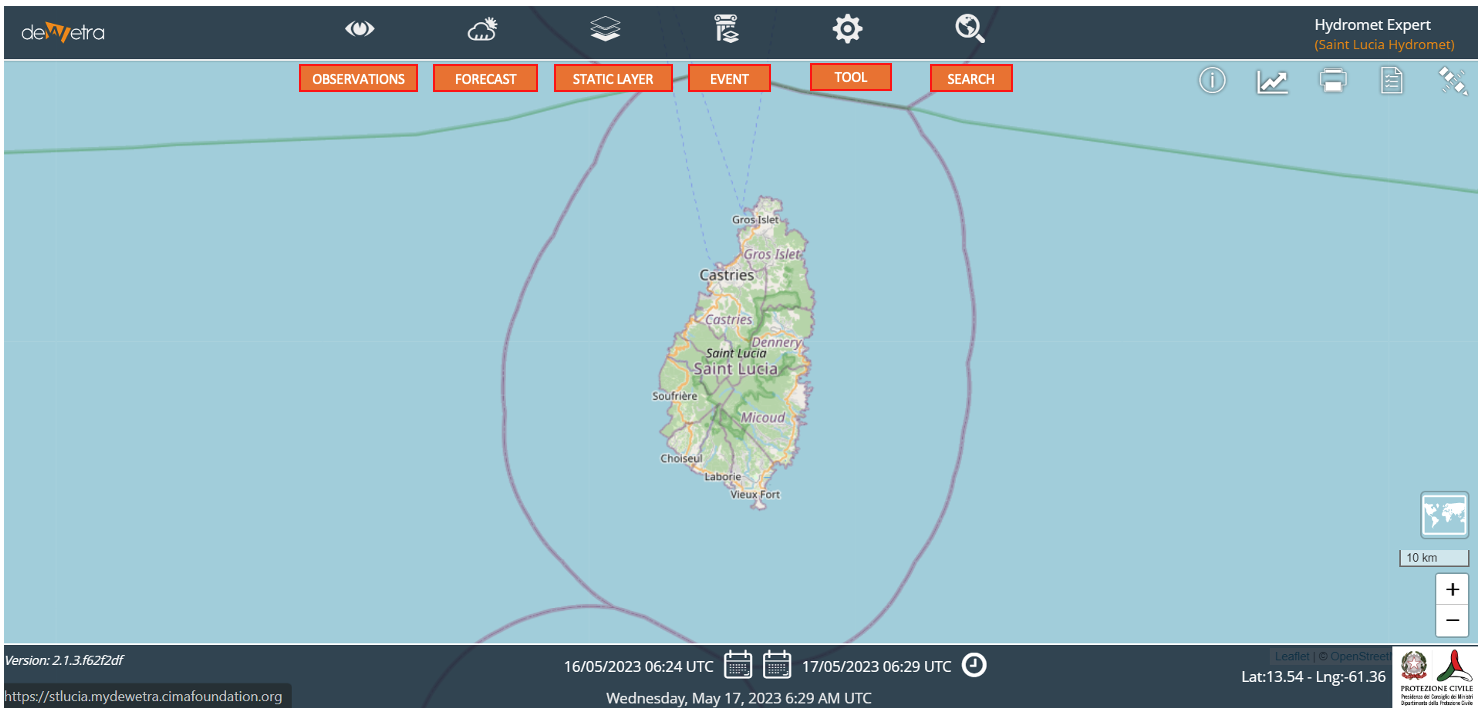
¶ Toolbar
The Toolbar contains many action buttons, depending on user's profile, like the following:
- Observations: is the section dedicated ot observational data and diagnostic models
- Forecast Models: lists all the available forecast systems (numerical weather prediction models, hydrological models, landslide susceptibility models;
- Static Layers: provides all the information needed to design a comprehensive risk scenario such as the exposures or the hazard maps
- Events: is the category that groups all the layers concerning disasters happened in the past such as floods, earthquakes, fires, et c.
- Tools: enables some ancillary functions such as Add a WMS, Risk Scenarios, et c.
- Search: is the tool allowing the users to search for any element visualized by the platform such as weather stations, toponyms, et c.
¶ Display
The time range of the data the system is visualizing are shown in the Display. Within this area users may find:
- the initial date of the time range selected by the users
- the end date of the time range selected by the users
- the current date
By default, the application will set the limits of the time range between "now" (i.e., current date and UTC time) and 24 hours before (which is assumed as the beginning of the period of the analysis).
In the display there are four action buttons:
- the two calendar icons allow the users to modify, respectively, the starting date and the end of the time range. By clicking on the buttons, you can set both start and end dates (minutes, hours, day, month and year) of any time window into the past and view the data available at that time (the so-called deferred time mode).
- the clock-shaped icon sets back the dates of beginning and end of the time range to the default mode
¶ Layer List
Unlike the previous version of Dewetra, the Layer List is dynamically created whenever the user loads a static and / or dynamic layer. Everytime a layer is selected by the user, the Layer List -containing the layer name and the available options for it- is displayed in the top left corner.
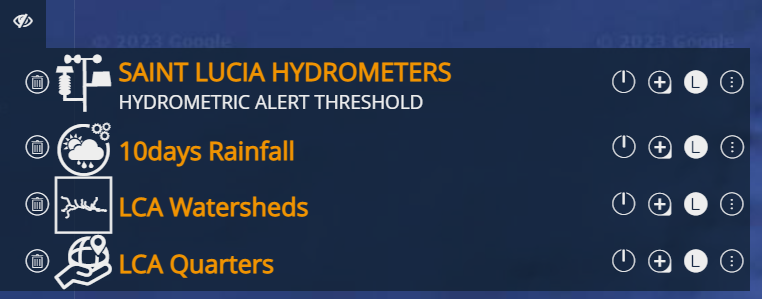
Each element of the list can be turned on or off and therefore displayed or hidden on the map, by acting on the control menu next to the name. Its relative position on the list corresponds to the position of the layer on the map: usually, the latter layer that has been loaded overlaps the former ones. Anyway, users may change the priority of a layer, by left-clicking on the layer icon next to the name in the Layer List and dragging it up or down.
The available features for the dynamic layers (Observations and Forecast), for the Static Layers and for the Events are described in the dedicated sections.
¶ Additional Tools
The Additional Tools button is placed in the upper right of the dashboard, immediately below the Toolbar and includes in order, from left to the right, the tools Share, info, Print map, Measure and Report.

¶ info
info is activated by left-clicking i icon and allows the user to pull on the information associated to each layer that has been previously loaded.
In the following example, the application of info to the rainfall layer: the pop-up window opens in the upper right part of the screen displaying the rain depth of the point that has been clicked on.

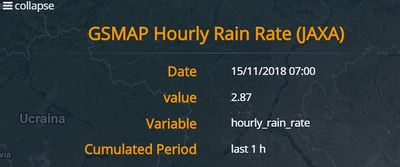
In the example, the pop-up window containing the rainfall depth value provided by the rainfall map layer.
If info is applied to a static layer, the pop-up window will show all the attributes available in the database for that layer. As an example, the next figure shows the result displayed in case a user clicked the Hospitals layer.
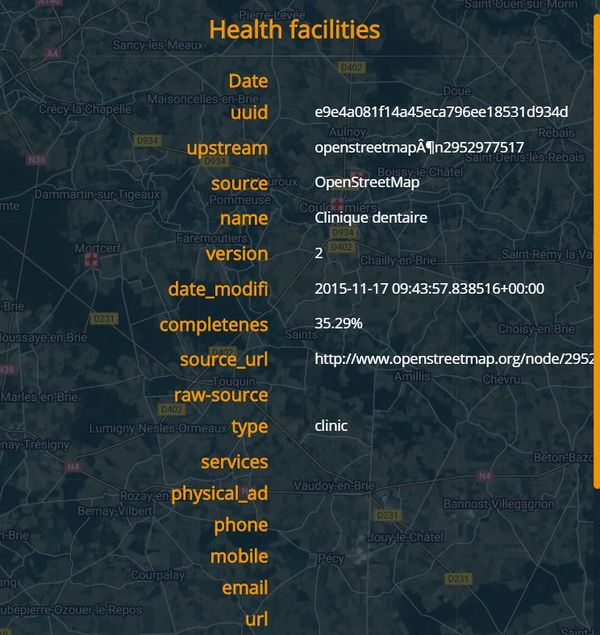

In the example, the pop-up window containing the attributes of the Hospitals layer.
To disable the info and return to the navigation mode, left-click again on the i icon.
¶ Print map
The Print map button allows the user to open a pop-up window containing a preview of the Control Map displayed at the time: by clicking the Download Image button located at the lowerright corner of the pop-up window, the map can be downloaded in .png format and saved on user's own local disk.

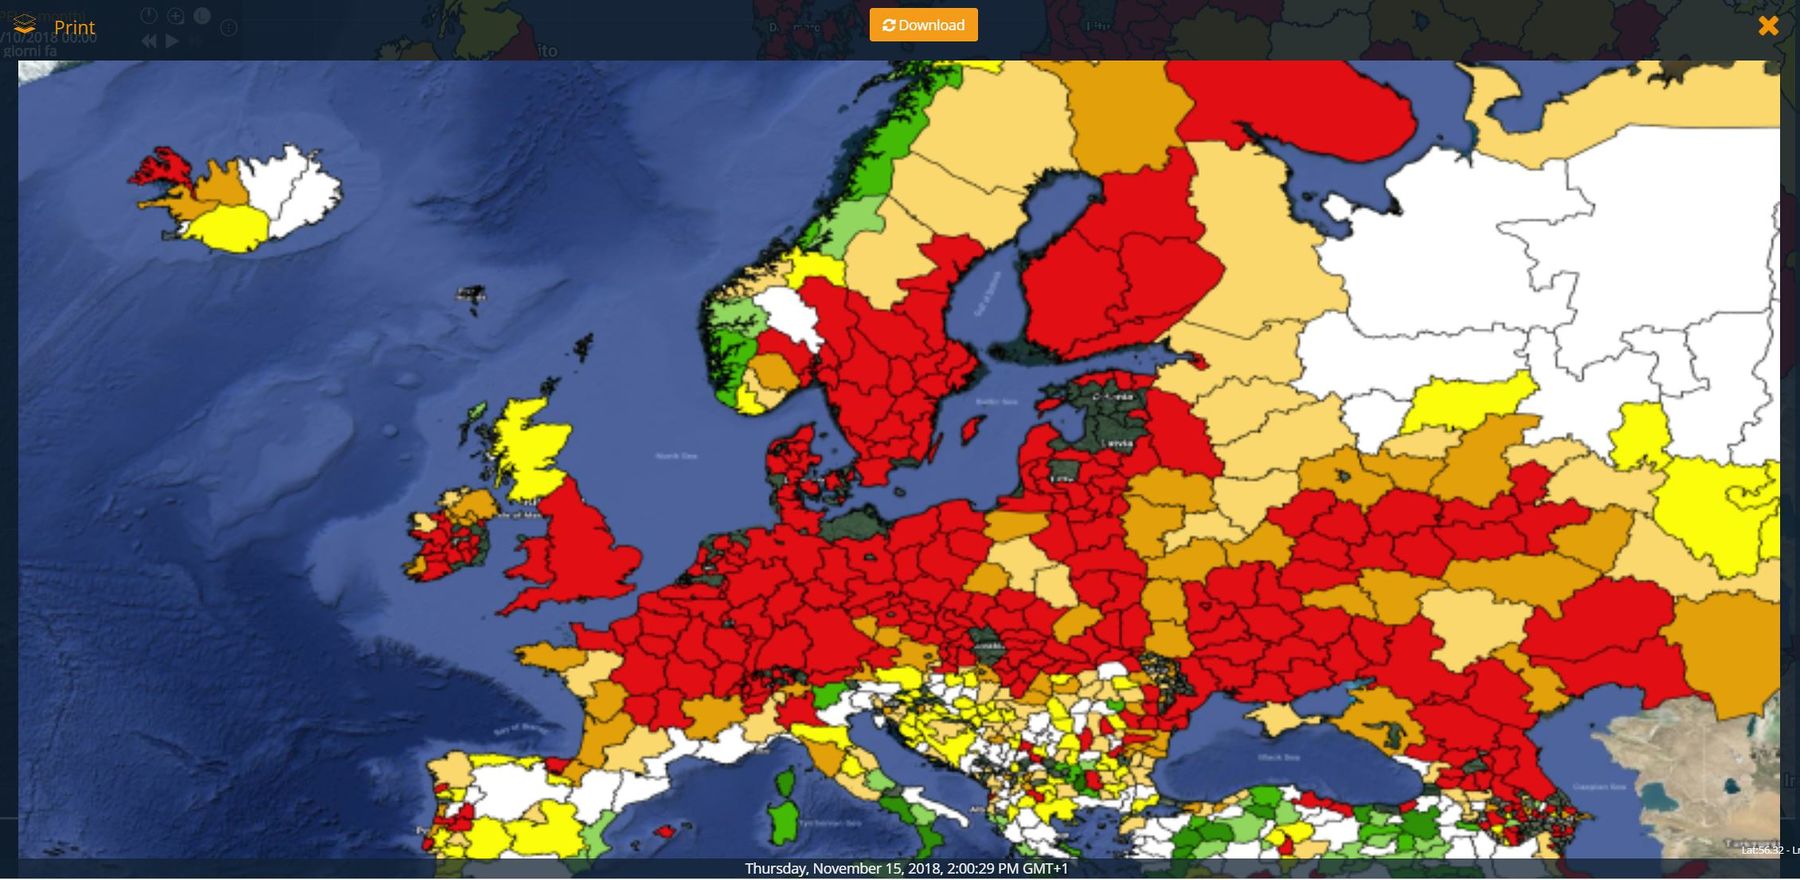
In the example, the pop-up window containing the print preview for the SPEI-6months.
In case the user does not want to download the map, the pop-up window can be closed by clicking on the X-shaped button in the upper right of the pop-up window.
¶ Measure Distance and Areas
The Measure button allows you to open a drop-down menu through which you can choose to Create a new measurement by left-clicking on the corresponding button. In this way the user can draw a straight line or pinpoint the vertices of a polygon by left-clicking directly on the map. At the same time, through a pop-up window, the system provides information about the line's length (in both kilometers and miles) and the area of the polygon (in both square metres and miles).
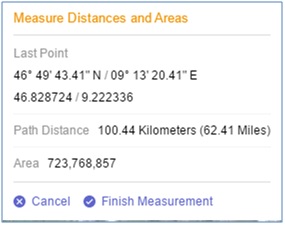
In the example, the pop-up window containing the length of the line drawn by the user and the area of the polygon.
To complete the action, left-click on Finish Measurement inside the pop-up menu: in this way, the last point on the map set is automatically connected to the first. When the measurement is completed, the system displays the length of the solid line and area of the polygon. Also, user may choose whether to delete it or to centre the Control Map on the line (polygon) that has been previously drawn.
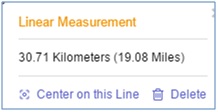
In the example, the pop-up window containing the information displayed by the system once the action has been completed by the user.
¶ Report
The Report tool allows the user to automatically capture the active window containing one or more of the layers previously loaded and to draft a report with the captures.
The first step consists in launching the application through the icon displayed in the figure below

The icon by which users enable the Report function.
Once the layer has been loaded, the user may add it to the report by clicking on the Send to Report icon that appears below the Report launch button as the mouse is hovered on it, see the figure below.
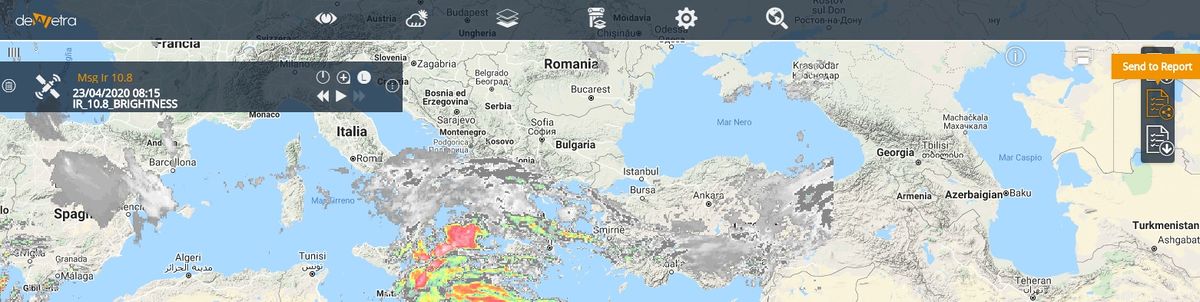
Users may add as many captures as they need, each capture will be automatically copy-pasted to a single page of the report together with its legend, provided it is sent to the report.
Figures may consist of as many layers as user requires, with no limitations whatsoever.
Once the user has added all the neeeded figures, the report might be finalized and downloaded.
To do that, click again on the Report launch button to expand the manu and then click again on Download Report (see below).
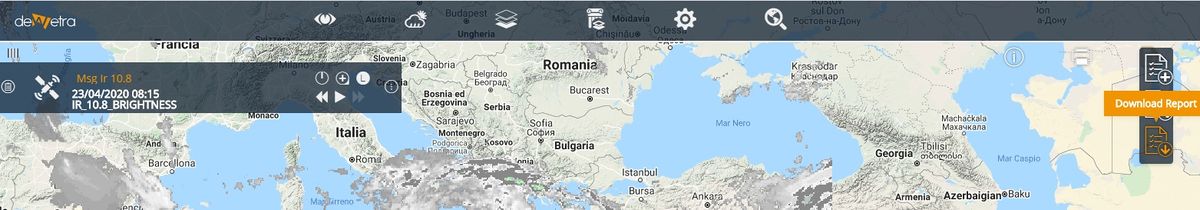

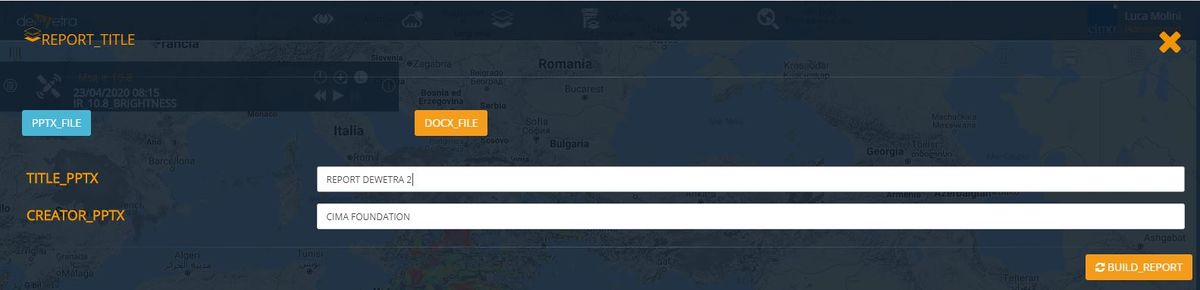
Once clicked, the system will display a menu through he/she will be enabled to:
- select which format the report will be saved as (.docx or .pptx)
- modify the author and/or the filename fields
- download the document

[Home] - [Access to the platform] - [User Interface] - [Observations] - [Forecast Models] - [Static Layers]