[Home] - [Access to the platform] - [User Interface] - [Observations] - [Forecast Models] - [Static Layers] - [Events]
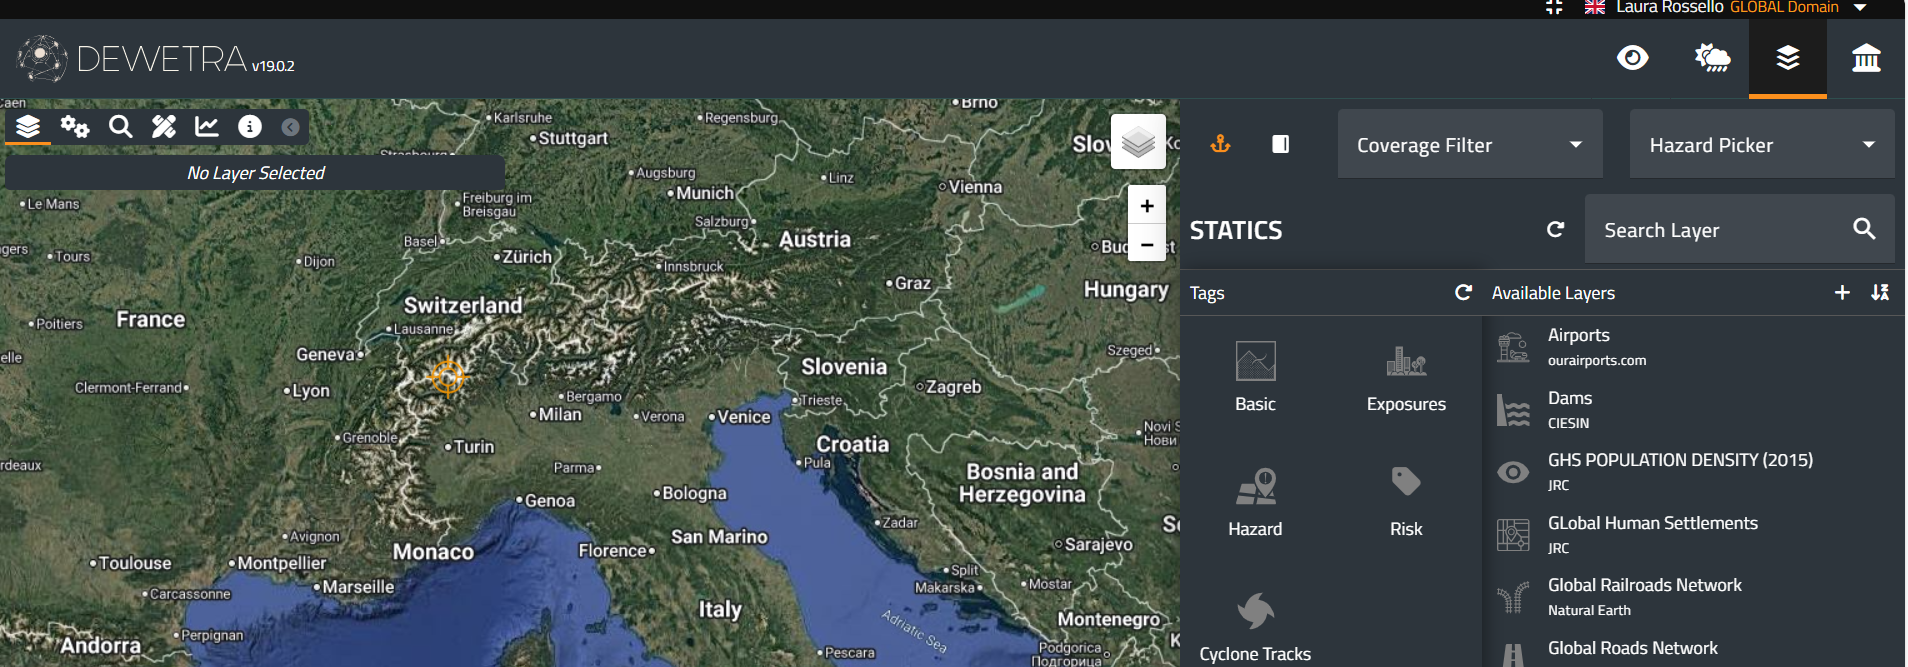
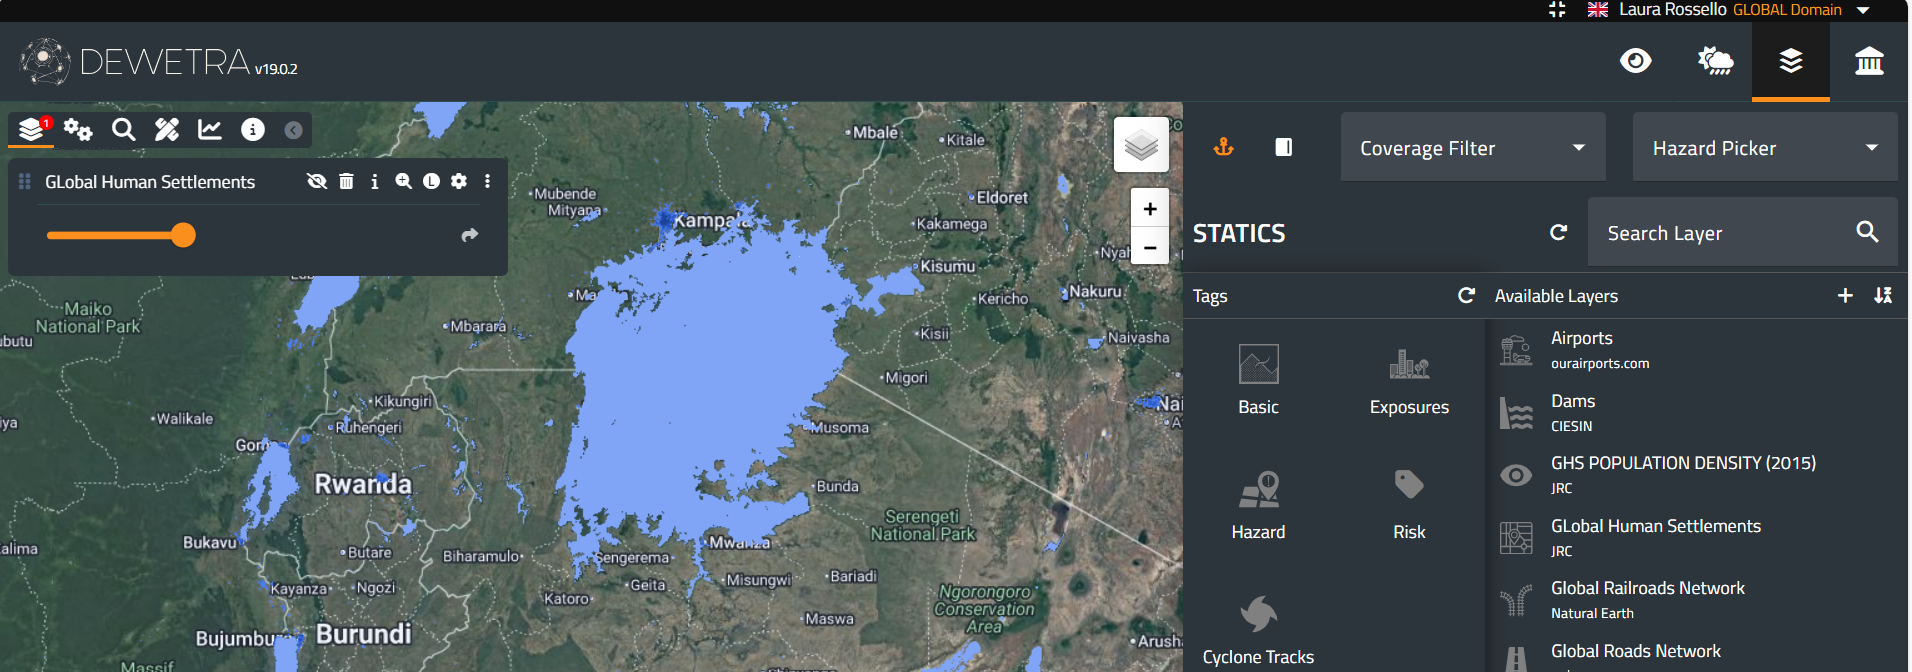
The third action button on the Toolbar is the Static Layers menu, which provides the user with access to all the time-independent data. Once the user clicks on the menu, a window appears. At the top, filters are available to refine the search for the desired layer: the coverage filter, hazard picker, and layer search.
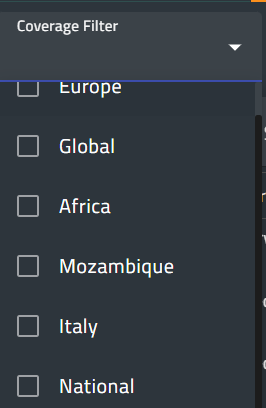
The coverage filter allows the user to select layers with a specific geographical extent. The following image shows an example of a list of extents available in the system; the lists may vary depending on the user. By default, all coverages are selected.
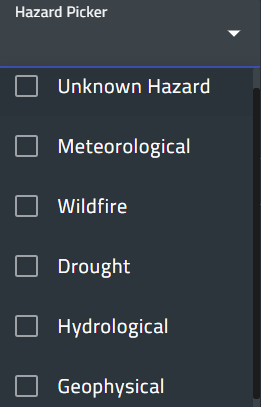
The hazard picker allows the user to select only the layer related to one or more hazards. The lists of hazards may vary depending on the users. By default, all hazards are selected.
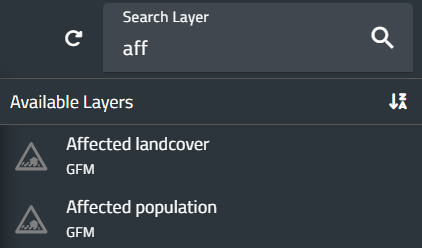
Finally, the search layer allows the user to find a layer by typing its name or part of it. This filter works only on the selected tags.
In the bottom part of the window, the list of layers appears: on the left, the list of tags that can be selected, and on the right, the layers associated with each tag. The following table lists the available layers, but the list of layers may vary depending on the users. More information about each layer can be accessed by clicking on its name.
Layers are available either as individual layers or as static layer groups. A layer group bundles several related layers under a single entry; the user can switch between the layers of the group from a drop-down menu in its Properties window (see below).
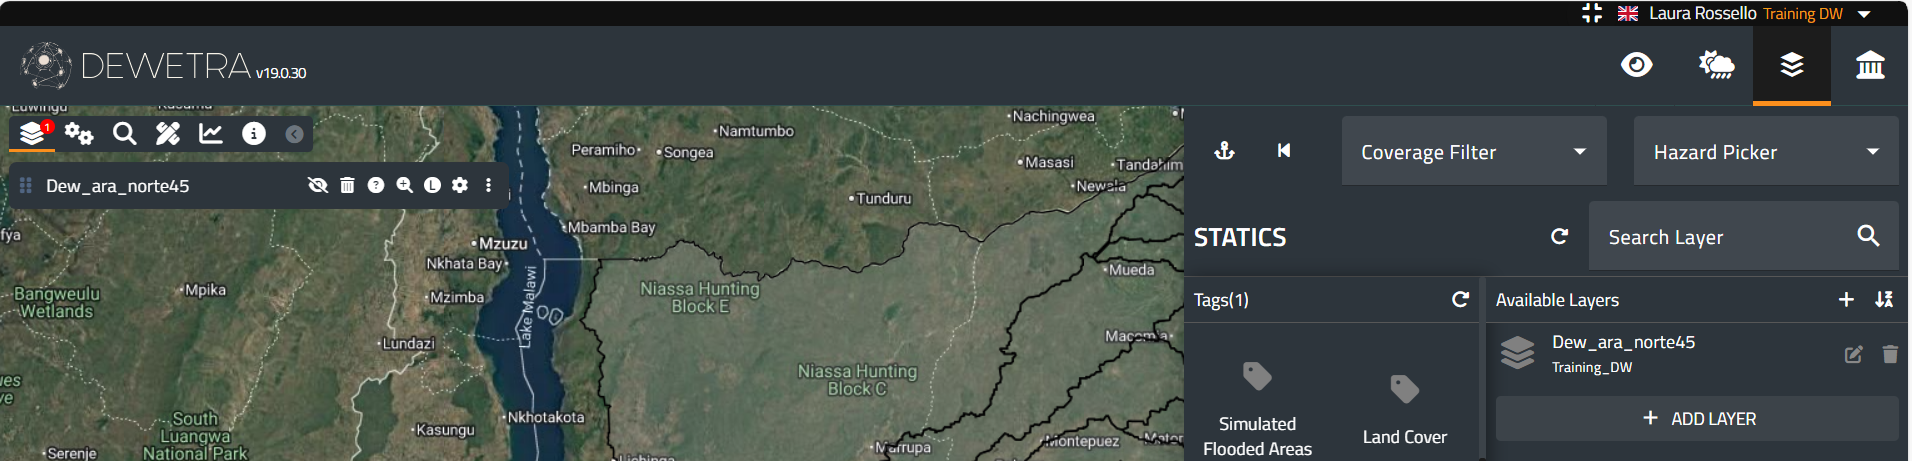
When a layer is loaded, it is automatically added to the Control Map and the Layer List (top left of the screen). While the layer is visible in the Control Map, the Layer List is displayed as shown in the following image, providing additional information and access to specific functions:
- To the left of the layer name in the Layer List, an icon with six dots allows users to drag the layer up or down within the list. The order of the layers in the list determines their display order on the map, with the top layer in the list also appearing on top of the map, and so the following in order.
- To the right of the layer name in the Layer List, a set of buttons is available to the user:
- Hide layer enables the user to temporarily hide a previously loaded layer without deleting it from the list; pressing the same button restores its visibility.
- Remove layer, the trash-can icon, by means of this button, the previously loaded layer can be removed from the list
- Layer details, the i icon, opens a window displaying some information and metadata about the layer
- Zoom to Layer allows the user to set the zoom back to the default extent for that layer
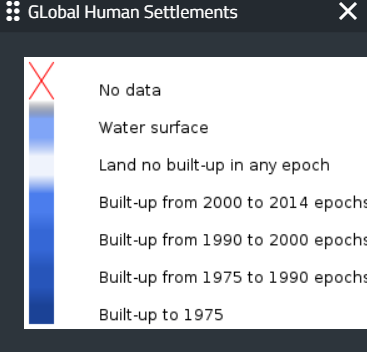
- Legend displays the pop-up window showing the legend for the selected layer. The following image shows an example of the legend for the Global Human Settlements layer.
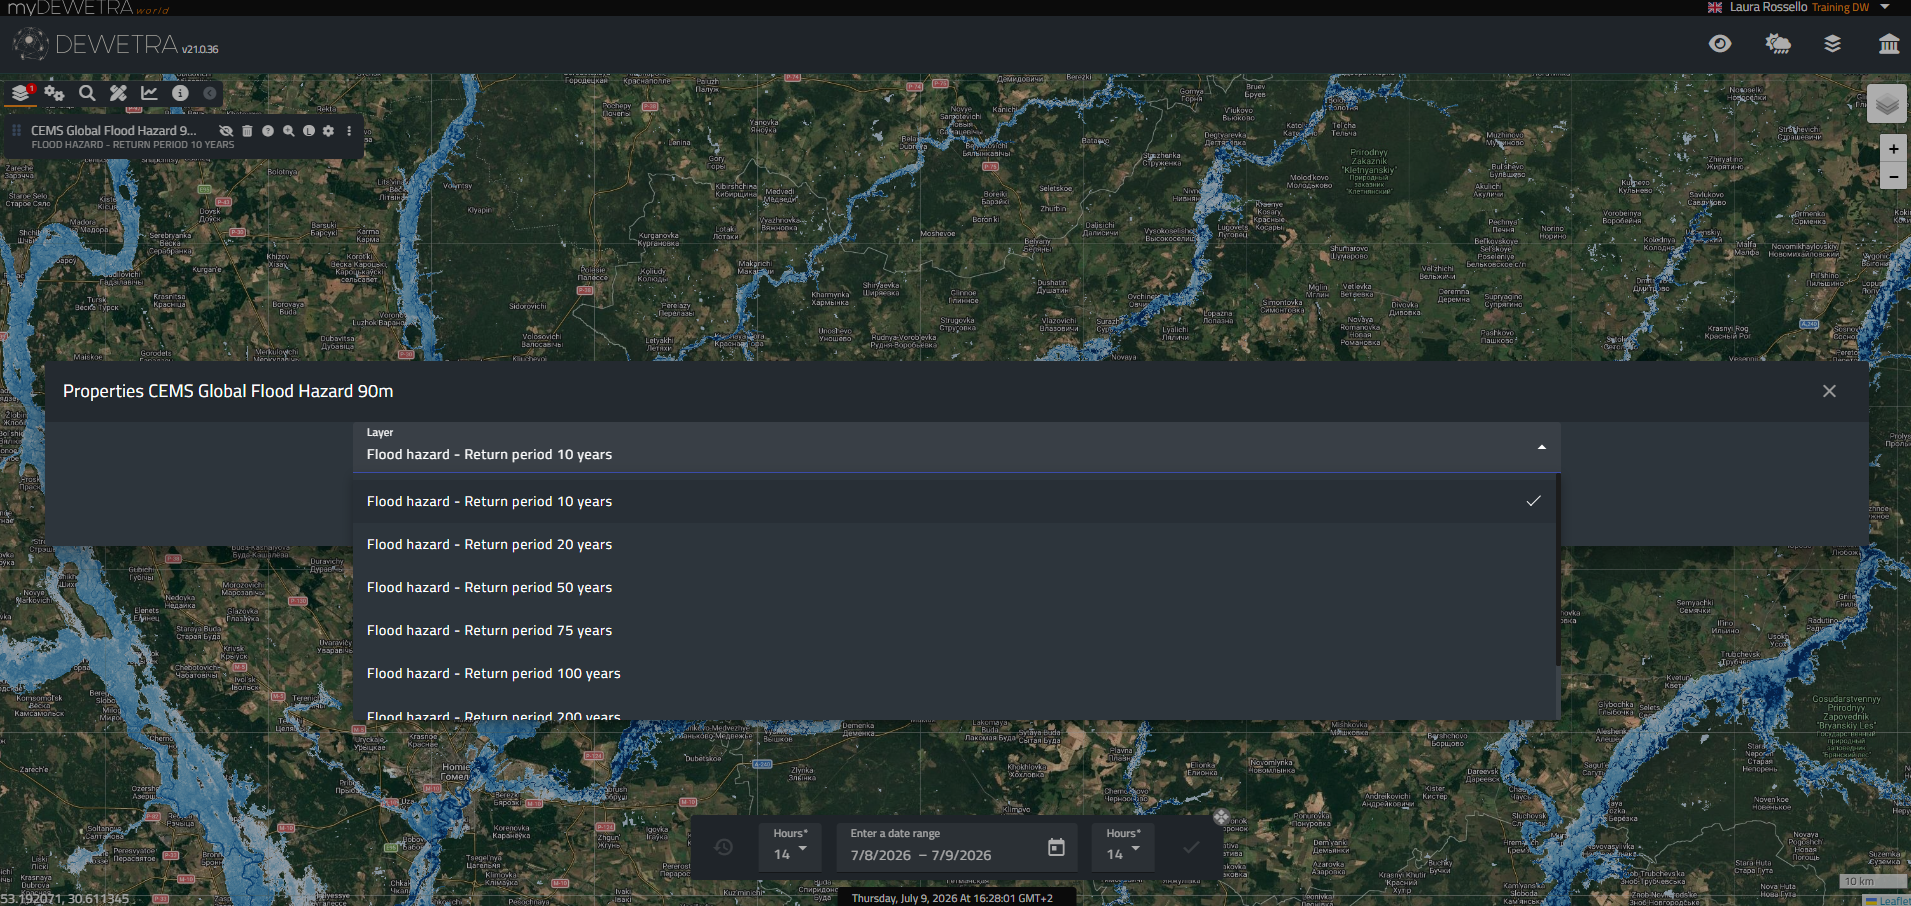
- Properties button opens a window with the properties of the layer. For a static layer group, this window also includes a drop-down menu that lets the user choose which of the grouped layers to display on the map. The following image shows an example of the drop-down menu for the JRC Flood Hazard menu:
- Expand option displays additional buttons that provide access to functions such as:
- the slider to adjust the transparency/opacity of each layer
- the metadata button allows the user to view the information and metadata file associated with the layer
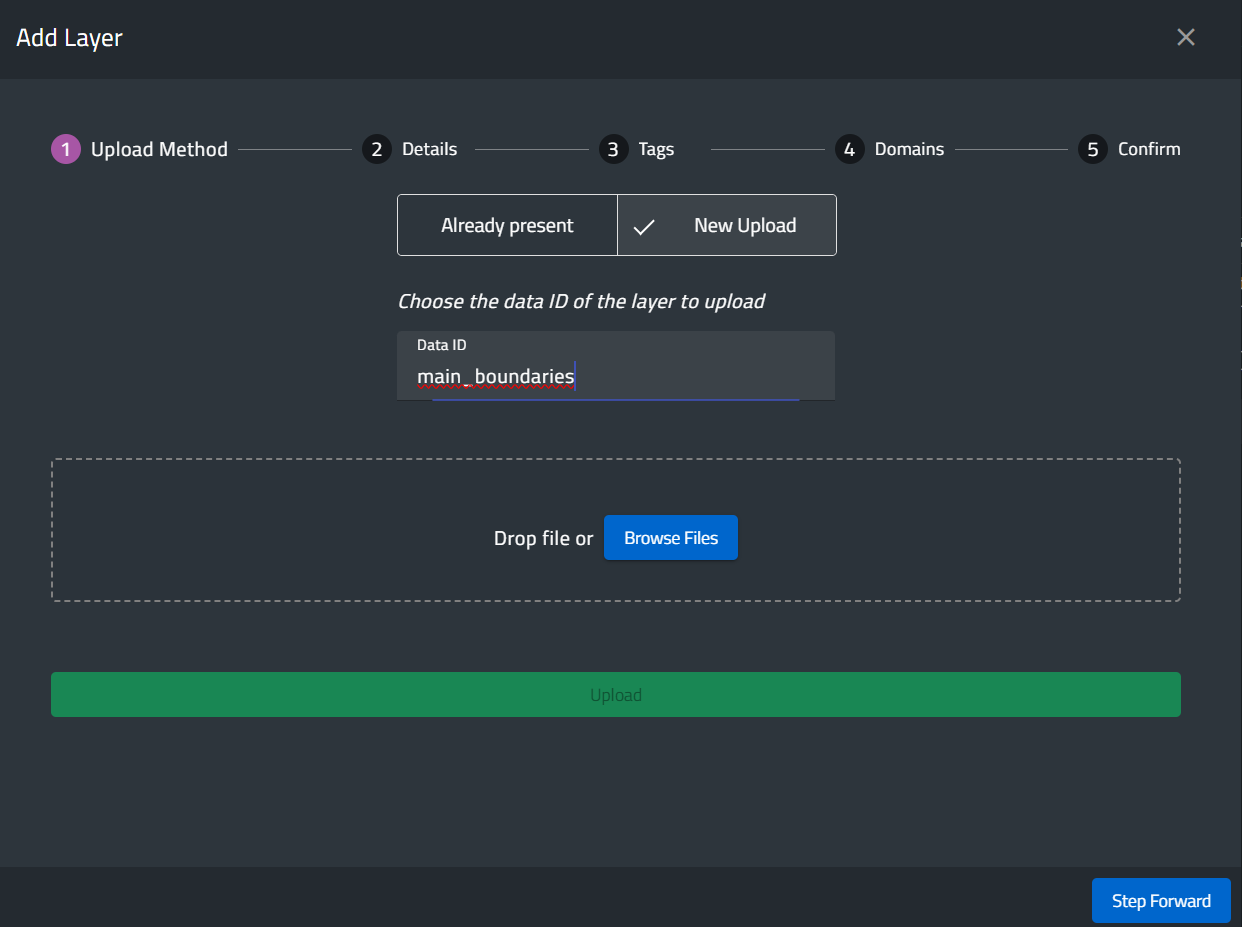
At the bottom of the layer list, an additional function allows users to add a new layer: by clicking the button, a window will appear as shown in the figure below.
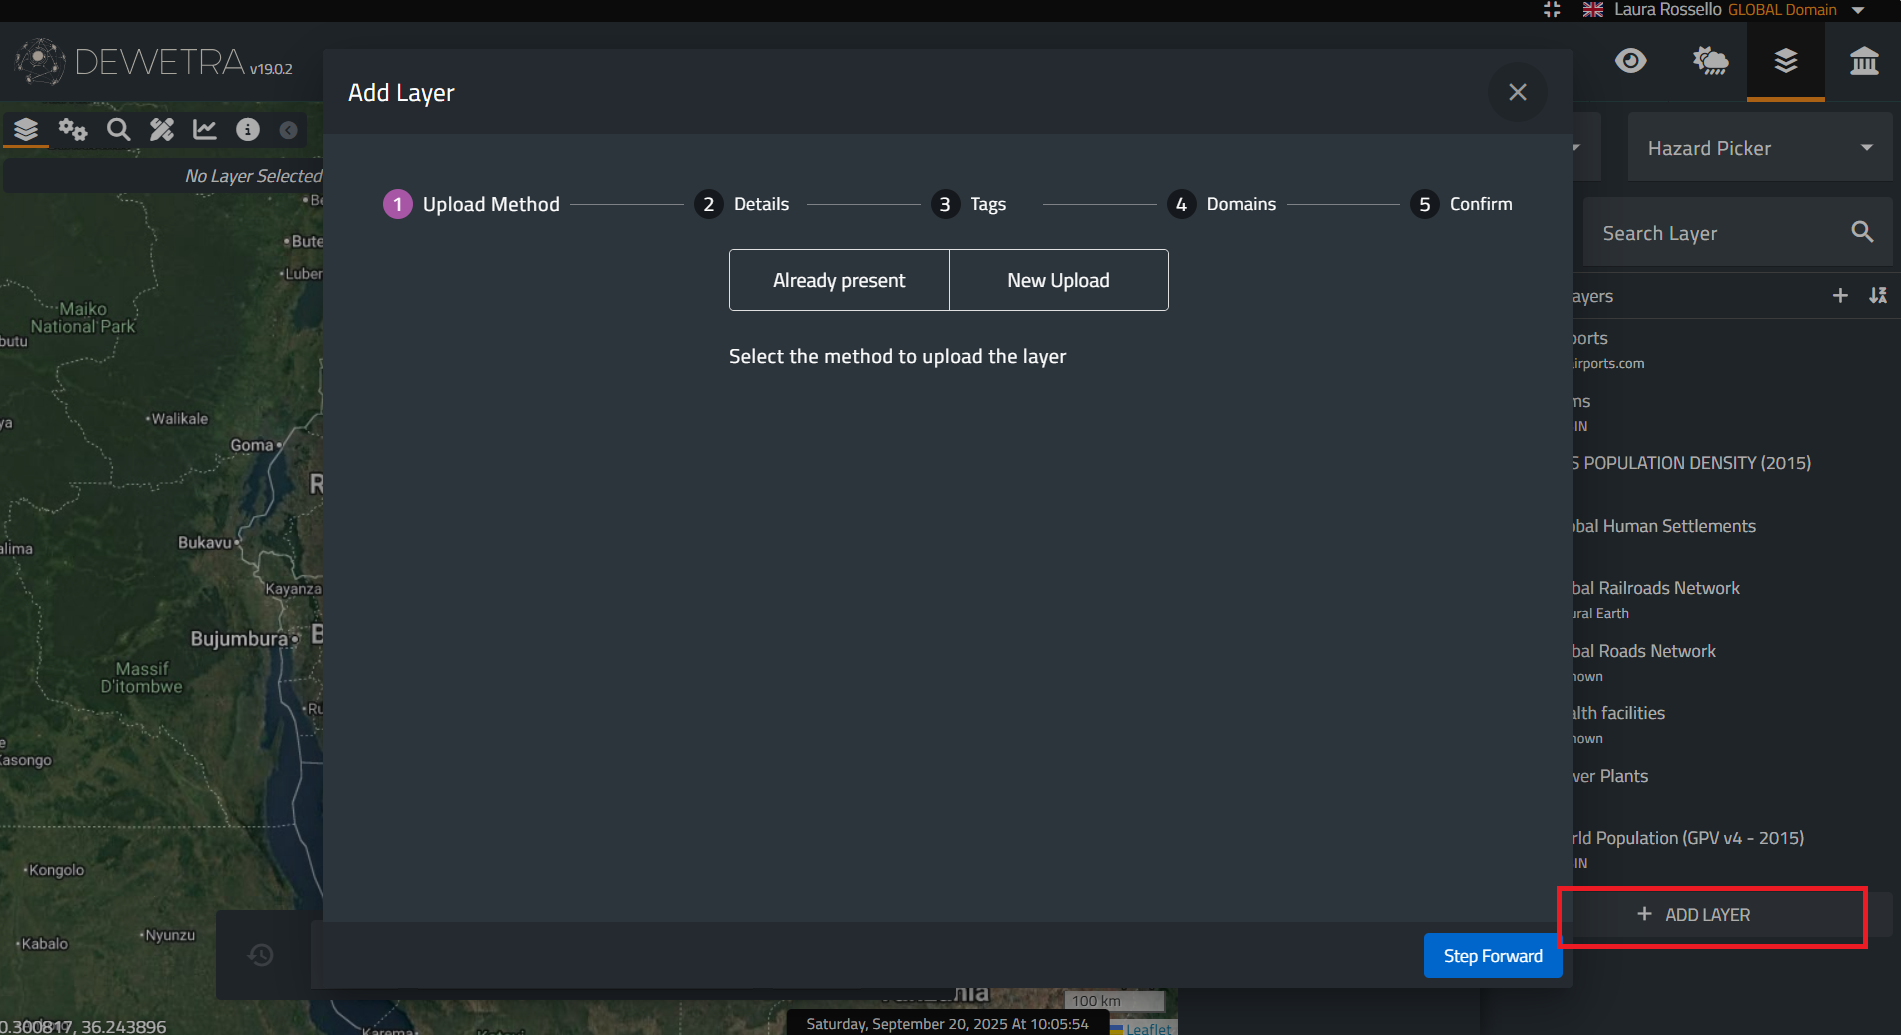
The New Upload feature allows users to add a new layer in GeoPackage format for vector data or in GeoTIFF format for raster data.
Users may write a Data ID that will be the ID in the myDEWETRA database, and then a window will appear as in the following image :
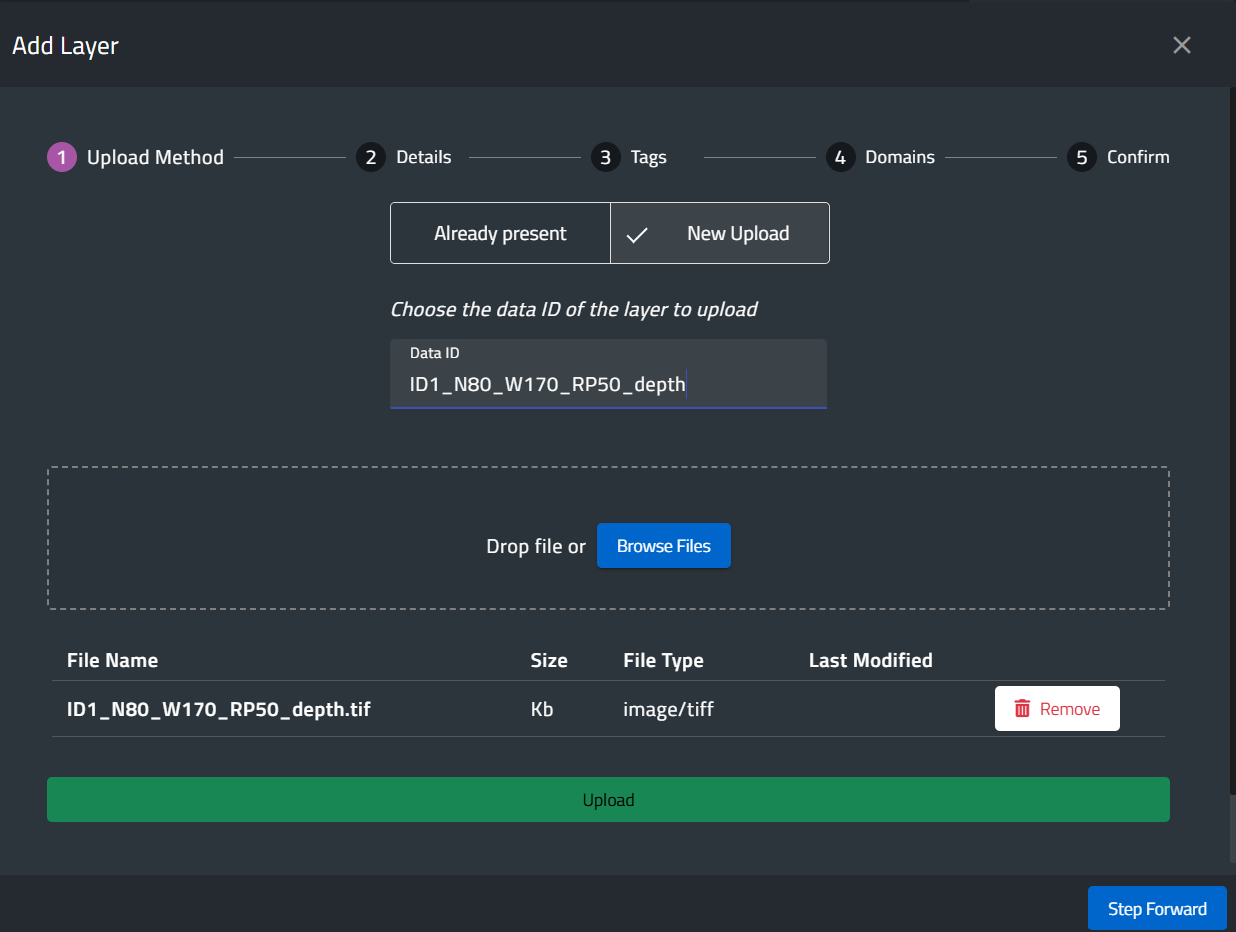
Users may now drop files or browse for files in the previously mentioned format.
The layers will appear in the window, and by pressing “Upload” they will be uploaded into the system.
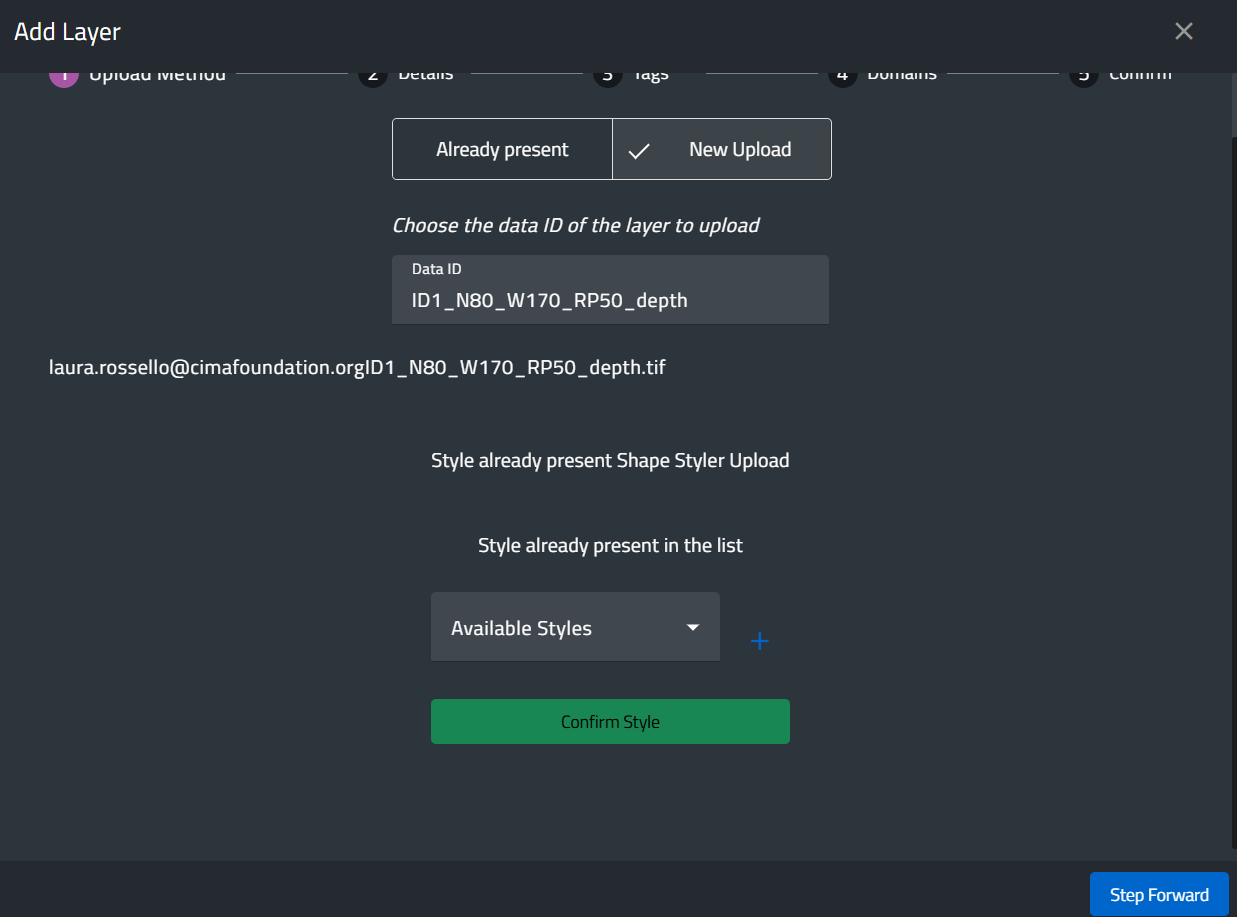
The next step allows users to either select an existing style for the layer or upload a new style in SLD format.
In the next step, users can define various characteristics of the layer, such as its name, description, icon, source, geographical extent, coverage filter, and category.
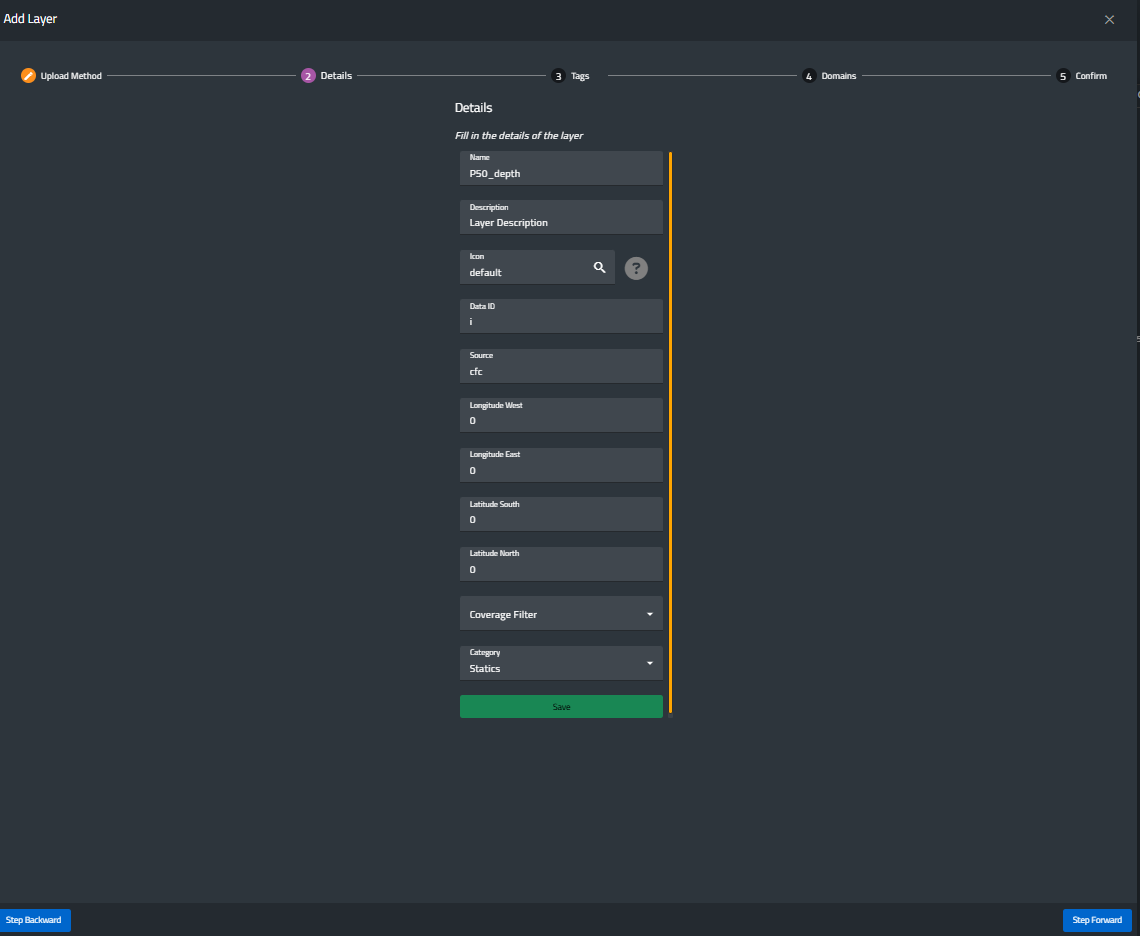
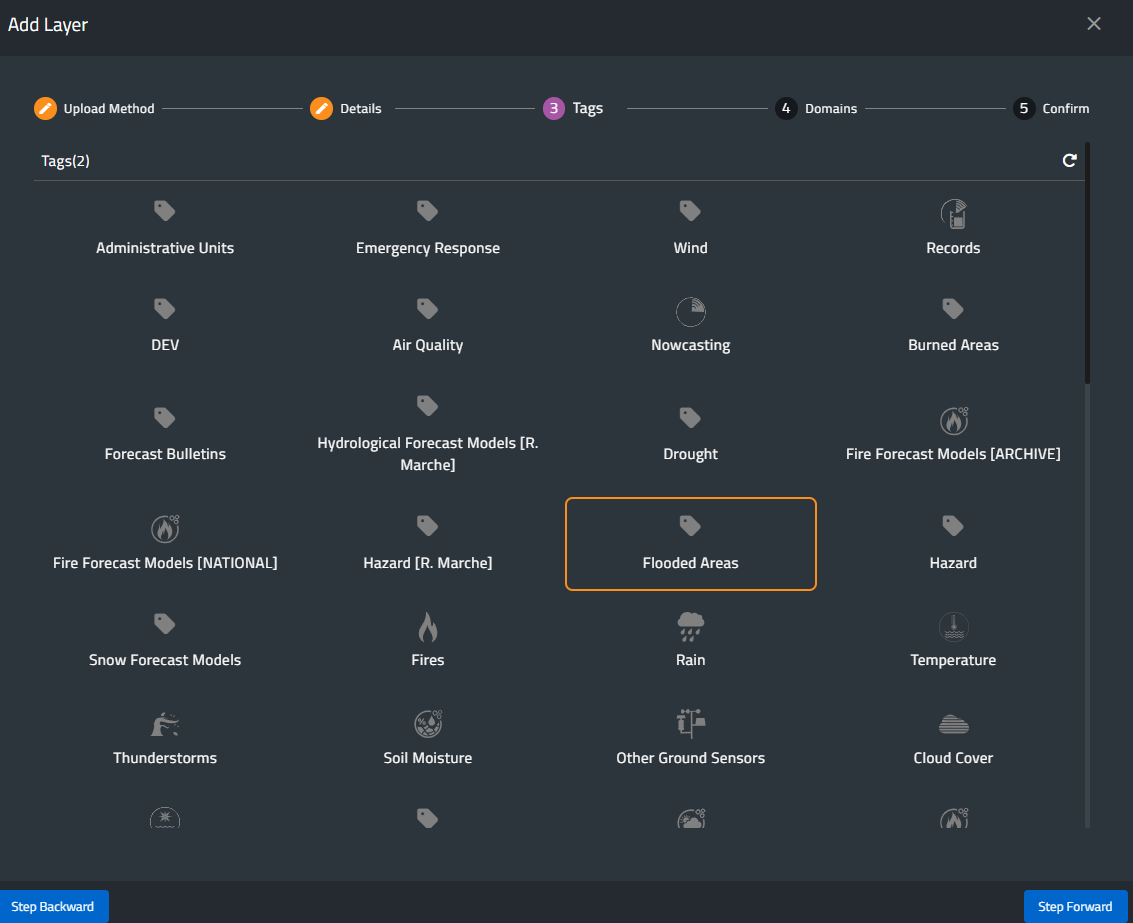
By pressing Save, the next step will appear. At this stage, users are asked to assign a tag to the layer. Tags must be chosen from the existing ones.
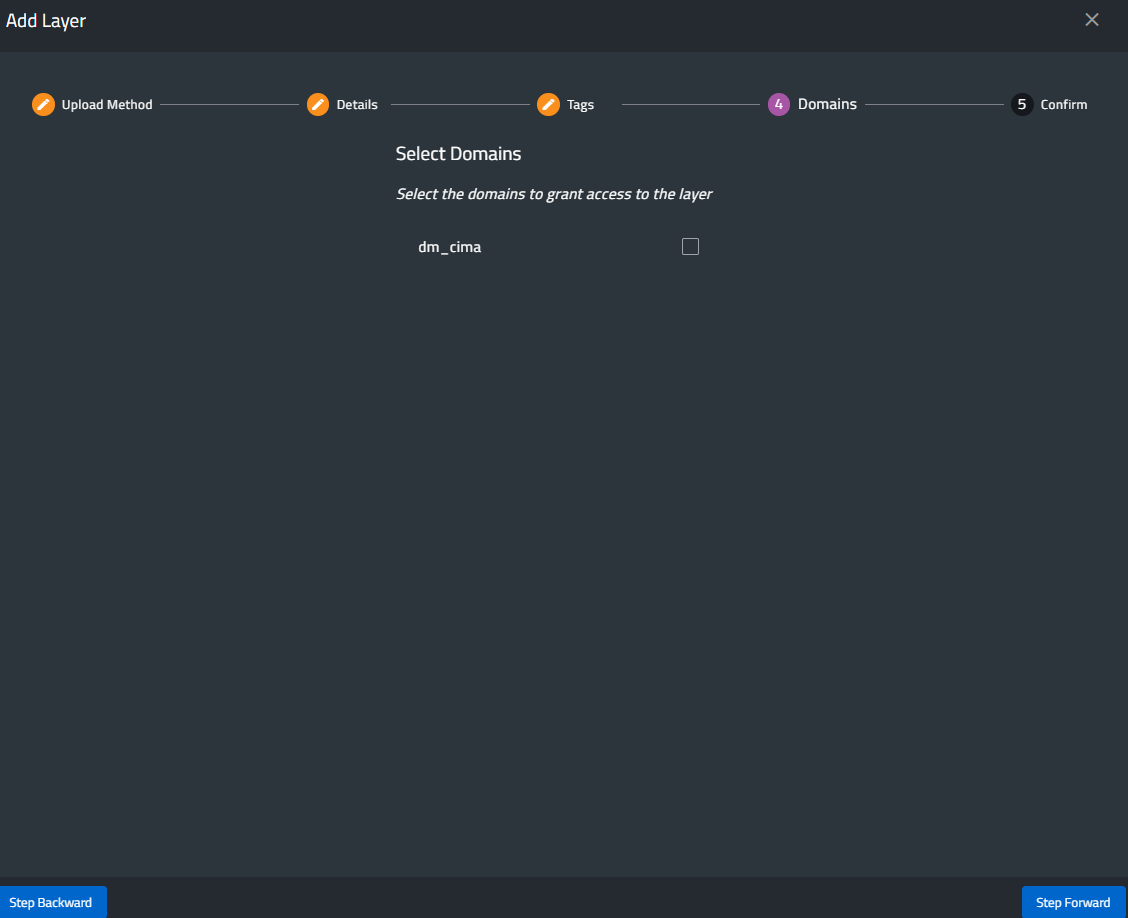
The layer will then be assigned to one or more domains. Please note that domains are strictly related to user permissions, meaning that specific users can add layers only for their own usage.
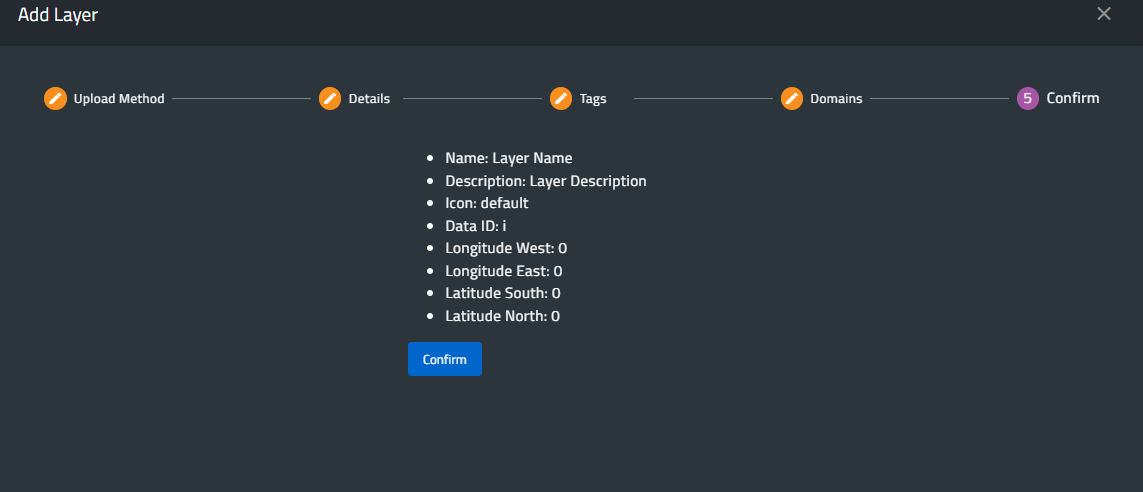
Finally, in the last step, the details are summarized. By pressing Confirm, the layer will be added to the layer list in the static menu.
Once the new layer is uploaded into the platform, it is possible to modify the layer or remove it from the menu. These functions are available only for the user that performed the uploading of the layer.
[Home] - [Access to the platform] - [User Interface] - [Observations] - [Forecast Models] - [Static Layers] - [Events]